March 8, 2015
Lesson
Basic – Bullish or Bearish Bias
How do you tell the price action is bullish bias or bearish bias?
Generally when price action is below moving average (MA) such as 20 MA, you can classify the price action is bearish bias, vice verse when price action above MA, such as 20 MA you can classify the price action is bullish bias.
Or when the fast moving average is below slow moving average, it is bearish bias, vice verse when fast moving average is above slow moving average, it is bullish bias. Shorter period moving average as compare to a longer period moving average, shorter period MA is also called fast MA, longer period MA is called slow MA.
When MA is pointing down, or south is considered down trend, and vice verse when MA is point up or north is considered up trend.
Oscillator Moving Average Convergence Divergence
MACD is a popular trend following momentum indicator that shows the relationship of two moving averages of prices action; the MACD line and signal line.
Four MACD Signals:
- Crossovers – Sell Strategy, MACD crosses below the signal line. Buy Strategy, MACD rallies above the signal line. It is advisable to wait for confirmation to reduce possible whipsaw.
- Divergence – The security price action diverges from the MACD. It signals the end of the current trend.
- Cross Zero Line – MACD moves above or below zero line. Upward trend: Cross above zero line, short MA above long MA. Downward trend: Cross below zero line, short MA below long MA.
- Dramatic rise or fall – MACD rises or decline dramatically – when the shorter moving average pulls away from the longer-term moving average – Oversold or Overbought.
Free Singapore Stocks MACD Scan for Stocks closed greater than thirty (30) cents on Friday March 6, 2015
- Stock volume traded greater 500K
- MACD line crosses above MACD signal – Bullish trend
- MACD line crosses above zero line – Bullish trend
- MACD Histogram +ve Divergence – Bullish trend
- MACD line crosses below MACD signal – Bearish trend
- MACD line crosses below zero line – Bearish trend
- MACD Histogram -ve Divergence – Bearish trend
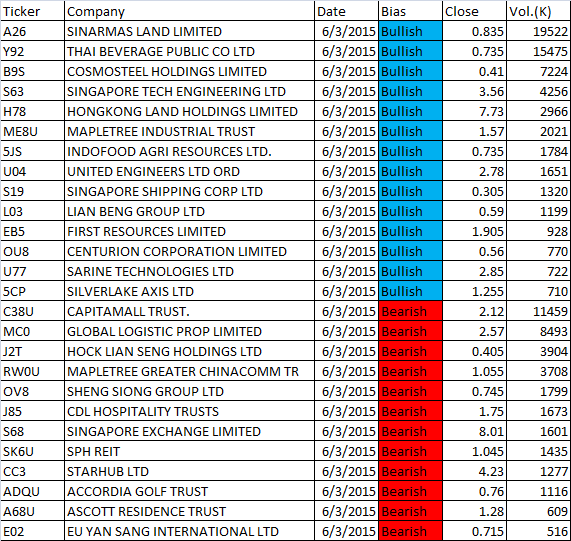
Sorted by bullish or bearish and volume.
Thanks for visiting this extra ordinary site, AmiBrokerAcademy.com.
Watch this space here, some great stock will be analyse here. See you more.
Moses
DISCLAIMER
Stock trading is not a get rich quick scheme and it is high risk.
Information provided here is of the nature of a general comment only and no intend to be specific for trading advice. It has prepared without regard to any particular investment objectives, financial situation or needs. Information should NOT be considered as an offer or enticement to buy, sell or trade.
You should seek advice from your broker, or licensed investment advisor, before taking any action.
Once again, the website does not guarantee any results or investment return based on the information and instruction you have read here. It should be used as learning aids.
Trading is personal. You are responsible for your own trading decision.
The comment is the author personal experience. There is no intent for your believe and follow.