3 October, 2018
Thank you for visiting the site. Hope you like the content.
MACD Example – Capitaland
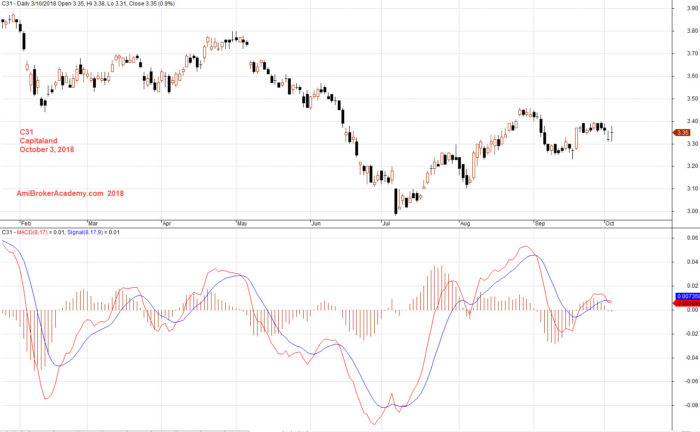
October 3, 2018 Capitaland and MACD
MACD Example – Sembcorp Industries
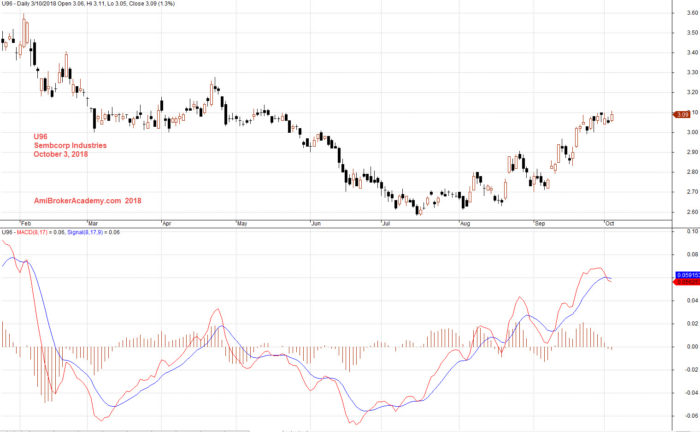
October 3, 2018 Sembcorp Industries and MACD
Free MACD Scan Five-day Singapore Stock MACD Screening Results on 26 September to 2 October 2018
Remember all setup can fail. This is true for all indicators. It is also true for MACD signals setup. See some of the MACD setup fail examples on this website.
These are the six types of MACD Signals:
- MACD line crosses above MACD signal – Bullish trend
- MACD line crosses above zero line – Bullish trend
- MACD Histogram +ve Divergence – Bullish trend
- MACD line crosses below MACD signal – Bearish trend
- MACD line crosses below zero line – Bearish trend
- MACD Histogram -ve Divergence – Bearish trend
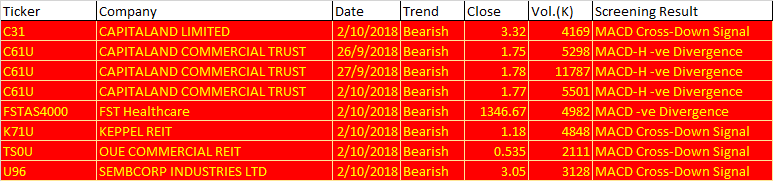
September 26 to October 2, 2018 Singapore Stock Five-day MACD Scan Results
| Ticker | Company | Date | Trend | Close | Vol.(K) | Screening Result |
| C31 | CAPITALAND LIMITED | 2/10/2018 | Bearish | 3.32 | 4169 | MACD Cross-Down Signal |
| C61U | CAPITALAND COMMERCIAL TRUST | 26/9/2018 | Bearish | 1.75 | 5298 | MACD-H -ve Divergence |
| C61U | CAPITALAND COMMERCIAL TRUST | 27/9/2018 | Bearish | 1.78 | 11787 | MACD-H -ve Divergence |
| C61U | CAPITALAND COMMERCIAL TRUST | 2/10/2018 | Bearish | 1.77 | 5501 | MACD-H -ve Divergence |
| FSTAS4000 | FST Healthcare | 2/10/2018 | Bearish | 1346.67 | 4982 | MACD -ve Divergence |
| K71U | KEPPEL REIT | 2/10/2018 | Bearish | 1.18 | 4848 | MACD Cross-Down Signal |
| TS0U | OUE COMMERCIAL REIT | 2/10/2018 | Bearish | 0.535 | 2111 | MACD Cross-Down Signal |
| U96 | SEMBCORP INDUSTRIES LTD | 2/10/2018 | Bearish | 3.05 | 3128 | MACD Cross-Down Signal |
Moses Singapore Stock Scan
AmiBroker Academy.com
Disclaimer:
The above result is for illustration purpose. It is not meant to be used for buy or sell decision. We do not recommend any particular stocks. If particular stocks of such are mentioned, they are meant as demonstration of Amibroker as a powerful charting software and MACD. Amibroker can program to scan the stocks for buy and sell signals.
These are script generated signals. Not all scan results are shown here. The MACD signal should use with price action. Users must understand what MACD and price action are all about before using them. If necessary you should attend a course to learn more on Technical Analysis (TA) and Moving Average Convergence Divergence, MACD.
Once again, the website does not guarantee any results or investment return based on the information and instruction you have read here. It should be used as learning aids only and if you decide to trade real money, all trading decision should be your own.