June 17, 2020
Welcome to AmiBroker Academy, free China, Hong Kong
Stock (from our limited collection in our database) MACD screener results . Thanks for visiting the site.
We use powerful AmiBroker charting software tool, ALF scripts to screen our data base for our capture non-US stocks data.
We look for Six types of MACD Signals:
- MACD line crosses above MACD signal – Bullish trend
- MACD line crosses above zero line – Bullish trend
- MACD Histogram +ve Divergence – Bullish trend
- MACD line crosses below MACD signal – Bearish trend
- MACD line crosses below zero line – Bearish trend
- MACD Histogram -ve Divergence – Bearish trend
Selection criteria is any stock 5 dollars (the stock local currency) or more and has minimum 5,000,000 stock changed hands.
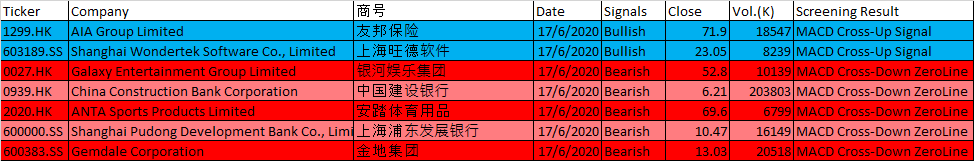
Free Moses China and Hong Kong Stocks 中国与香港证券 MACD One-day Signals 一日信号 on 17 June, 2020
Remember to trade what you see and all set up and signals can fail.
| Ticker | Company | 商号 | Date | Signals | Close | Vol.(K) | Screening Result |
| 1299.HK | AIA Group Limited | 友邦保险 | 17/6/2020 | Bullish | 71.9 | 18547 | MACD Cross-Up Signal |
| 603189.SS | Shanghai Wondertek Software Co., Limited | 上海旺德软件 | 17/6/2020 | Bullish | 23.05 | 8239 | MACD Cross-Up Signal |
| 0027.HK | Galaxy Entertainment Group Limited | 银河娱乐集团 | 17/6/2020 | Bearish | 52.8 | 10139 | MACD Cross-Down ZeroLine |
| 0939.HK | China Construction Bank Corporation | 中国建设银行 | 17/6/2020 | Bearish | 6.21 | 203803 | MACD Cross-Down ZeroLine |
| 2020.HK | ANTA Sports Products Limited | 安踏体育用品 | 17/6/2020 | Bearish | 69.6 | 6799 | MACD Cross-Down ZeroLine |
| 600000.SS | Shanghai Pudong Development Bank Co., Limited | 上海浦东发展银行 | 17/6/2020 | Bearish | 10.47 | 16149 | MACD Cross-Down ZeroLine |
| 600383.SS | Gemdale Corporation | 金地集团 | 17/6/2020 | Bearish | 13.03 | 20518 | MACD Cross-Down ZeroLine |
Moses Non-US Stock Scan
AmiBroker Academy.com
Disclaimer:
The above result is for illustration purpose. It is not meant to be used for buy or sell decision. We do not recommend any particular stocks on our website. If particular stocks of such are mentioned, they are meant as illustration or demonstration of Amibroker as a powerful charting software or MACD scanner. Amibroker can program to scan the stocks that have MACD buy or sell signals.
These are script generated signals. Not all scan results are shown here. The MACD signal should use with price action and confirmation. Users must understand what MACD and price action are all about before using them. If necessary you should attend a course to learn more about Technical Analysis (TA) and Moving Average Convergence Divergence, MACD.
Once again, the website does not guarantee any results or investment return based on the information and instruction you have read here. It should be used as learning aids only and if you decide to trade real money, all trading decision should be your own, and you should take your own responsibility.
Besides that all setup may fail.