Moses’s Singapore stock analysis. Inverted Head and Shoulders Pattern.
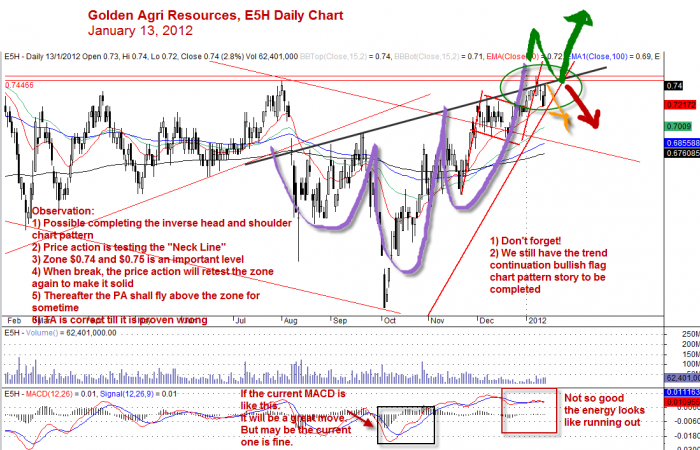
As commented earlier, Golden Agri Resources stock price action (PA) is fighting to clear the resistance zone $0.74 and $0.75 resistance level. When clear the next possible critical resistance to clear will be $0.83.
Friday, January 13, 2012 closed at $0.740 just right below the resistance zone. When you zoom out and look at it again you may notice that an inverted head and shoulders has completed the right shoulder. The price action is now at the ‘neckline’. Can you see it?
If this is true, it is a convergence of both the resistance and neckline. What does that mean? From a technical analysis (TA) stand points, a convergence means that the price action would respect before it next major change. Will see.
So go back to the story that we have painted so far from the chart. If you are a new visitor, feel free to browse around for the earlier posts for the storyline we try to built. We found bullish flag trend continuation pattern forming. Next, we saw a completion of the right shoulder of the inverted head and shoulder. The MACD is above zero line. Can we expect the price action to break above the resistance zone and continue to move higher? It will be more solid when the break out can retest the resistance zone and turn it to a support. The energy will be very strong when the MACD moving from below zero line to above zero line; this is just ideal situation.
Form your strategy and plan, plan your trade and trade your plan. Of course, you can still win if you trade randomly. This is pure luck.
Monitor the stock and trade with caution. Happy trading.
Moses, January 14, 2012
After Notes:
It seems like I know them all. No. By the way, I am not here in bragging rights. I enjoy looking at the chart and wondering what will happen next. Trading strategies are fun, it is even more fun in understanding what others see the price action or how a technical analysis trader see it too.
You should consider starting your own analysis if you have not done so. Enjoy the ups and downs of the trading journey. It is just like golf, it is personal. You may have a few good one but some how you can’t repeat it again. Don’t worry, it will come back again when you keep practice, practice and practice.
Golden Agri Resources Daily Chart
Golden Agri Resources, E5H Daily Chart - Inverted Head and Shoulders
DSICLAIMER
Information provided here is of the nature of a general comment only and no intend to be specific for trading advice. It has prepared without regard to any particular investment objectives, financial situation or needs. Information should not be considered as an offer or enticement to buy, sell or trade.
You should seek advice from your broker, or licensed investment advisor, before taking any action.
Once again, the website does not guarantee any results or investment return based on the information and instruction you have read here. It should be used as learning aids only and if you decide to trade real money, all trading decision should be your own.