11 May, 2018
Thank you for visiting the site. Hope you like the content.
5DW Renewable Energy Asia Group Stock Chart From Day One
Picture worth a thousand words, see chart Renewable Energy Asia Group stock performance since day one. In the good old day, many of the investor or trader, invest and keep. If you are in that category, you will feel very painful. Right?
Therefore, for trader you must get yourself upgraded by learning how to trade. Must have plan. Manage your trade.
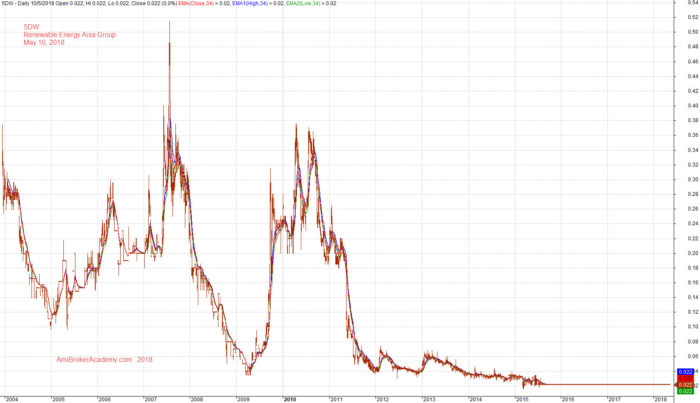
May10, 2018 Renewable Energy Asia Group from Day One
Free MACD Scan One-day Singapore Stock MACD Screening Results on May 9 2018
Remember all setup can fail. This is true for all indicators. It is also true for MACD signals setup. See some of the MACD setup fail examples on this website.
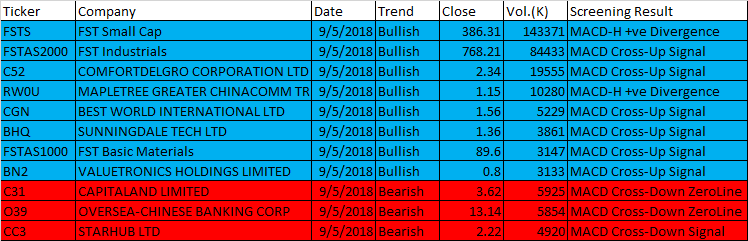
May 9, 2018 Singapore Stock One-day MACD Signals
These are the six types of MACD Signals:
- MACD line crosses above MACD signal – Bullish trend
- MACD line crosses above zero line – Bullish trend
- MACD Histogram +ve Divergence – Bullish trend
- MACD line crosses below MACD signal – Bearish trend
- MACD line crosses below zero line – Bearish trend
- MACD Histogram -ve Divergence – Bearish trend
| Ticker | Company | Date | Trend | Close | Vol.(K) | Screening Result |
| FSTS | FST Small Cap | 9/5/2018 | Bullish | 386.31 | 143371 | MACD-H +ve Divergence |
| FSTAS2000 | FST Industrials | 9/5/2018 | Bullish | 768.21 | 84433 | MACD Cross-Up Signal |
| C52 | COMFORTDELGRO CORPORATION LTD | 9/5/2018 | Bullish | 2.34 | 19555 | MACD Cross-Up Signal |
| RW0U | MAPLETREE GREATER CHINACOMM TR | 9/5/2018 | Bullish | 1.15 | 10280 | MACD-H +ve Divergence |
| CGN | BEST WORLD INTERNATIONAL LTD | 9/5/2018 | Bullish | 1.56 | 5229 | MACD Cross-Up Signal |
| BHQ | SUNNINGDALE TECH LTD | 9/5/2018 | Bullish | 1.36 | 3861 | MACD Cross-Up Signal |
| FSTAS1000 | FST Basic Materials | 9/5/2018 | Bullish | 89.6 | 3147 | MACD Cross-Up Signal |
| BN2 | VALUETRONICS HOLDINGS LIMITED | 9/5/2018 | Bullish | 0.8 | 3133 | MACD Cross-Up Signal |
| C31 | CAPITALAND LIMITED | 9/5/2018 | Bearish | 3.62 | 5925 | MACD Cross-Down ZeroLine |
| O39 | OVERSEA-CHINESE BANKING CORP | 9/5/2018 | Bearish | 13.14 | 5854 | MACD Cross-Down ZeroLine |
| CC3 | STARHUB LTD | 9/5/2018 | Bearish | 2.22 | 4920 | MACD Cross-Down Signal |
Have fun! Reader must understand what MACD is all about before using the results.
Moses Singapore Stock Scan
AmiBroker Academy.com
Disclaimer:
The above result is for illustration purpose. It is not meant to be used for buy or sell decision. We do not recommend any particular stocks. If particular stocks of such are mentioned, they are meant as demonstration of Amibroker as a powerful charting software and MACD. Amibroker can program to scan the stocks for buy and sell signals.
These are script generated signals. Not all scan results are shown here. The MACD signal should use with price action. Users must understand what MACD and price action are all about before using them. If necessary you should attend a course to learn more on Technical Analysis (TA) and Moving Average Convergence Divergence, MACD.
Once again, the website does not guarantee any results or investment return based on the information and instruction you have read here. It should be used as learning aids only and if you decide to trade real money, all trading decision should be your own.