24 May, 2018
Thank you for visiting the site. Hope you like the content.
Example of ABCD pattern, if you can draw and trade on ABCD. You can laughing all the way to the bank. Of course not easy lah. You see when the price action rebounce on the BC leg, you thought the price action is revering. Who will now the resistance turns support. if you look to your left you can understand the turning down was the former resistance too.
Manage your risk.
This is a classroom like discussion. So, don’t get big head.
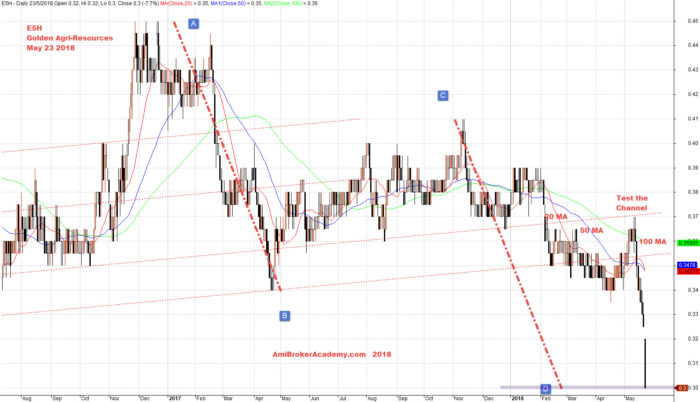
May 23, 2018 Golden Agri-Resouces and ABCD
Free MACD Scan One-day Singapore Stock MACD Screening Results on May 22 2018
Remember all setup can fail. This is true for all indicators. It is also true for MACD signals setup. See some of the MACD setup fail examples on this website.
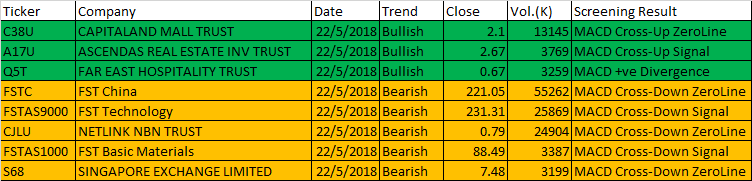
May 22, 2018 Singapore Stock 1-day MACD Scan Signals
These are the six types of MACD Signals:
- MACD line crosses above MACD signal – Bullish trend
- MACD line crosses above zero line – Bullish trend
- MACD Histogram +ve Divergence – Bullish trend
- MACD line crosses below MACD signal – Bearish trend
- MACD line crosses below zero line – Bearish trend
- MACD Histogram -ve Divergence – Bearish trend
| Ticker | Company | Date | Trend | Close | Vol.(K) | Screening Result |
| C38U | CAPITALAND MALL TRUST | 22/5/2018 | Bullish | 2.1 | 13145 | MACD Cross-Up ZeroLine |
| A17U | ASCENDAS REAL ESTATE INV TRUST | 22/5/2018 | Bullish | 2.67 | 3769 | MACD Cross-Up Signal |
| Q5T | FAR EAST HOSPITALITY TRUST | 22/5/2018 | Bullish | 0.67 | 3259 | MACD +ve Divergence |
| FSTC | FST China | 22/5/2018 | Bearish | 221.05 | 55262 | MACD Cross-Down ZeroLine |
| FSTAS9000 | FST Technology | 22/5/2018 | Bearish | 231.31 | 25869 | MACD Cross-Down Signal |
| CJLU | NETLINK NBN TRUST | 22/5/2018 | Bearish | 0.79 | 24904 | MACD Cross-Down ZeroLine |
| FSTAS1000 | FST Basic Materials | 22/5/2018 | Bearish | 88.49 | 3387 | MACD Cross-Down Signal |
| S68 | SINGAPORE EXCHANGE LIMITED | 22/5/2018 | Bearish | 7.48 | 3199 | MACD Cross-Down ZeroLine |
Moses Singapore Stock Scan
AmiBroker Academy.com
Disclaimer:
The above result is for illustration purpose. It is not meant to be used for buy or sell decision. We do not recommend any particular stocks. If particular stocks of such are mentioned, they are meant as demonstration of Amibroker as a powerful charting software and MACD. Amibroker can program to scan the stocks for buy and sell signals.
These are script generated signals. Not all scan results are shown here. The MACD signal should use with price action. Users must understand what MACD and price action are all about before using them. If necessary you should attend a course to learn more on Technical Analysis (TA) and Moving Average Convergence Divergence, MACD.
Once again, the website does not guarantee any results or investment return based on the information and instruction you have read here. It should be used as learning aids only and if you decide to trade real money, all trading decision should be your own.