May 21, 2014
Moses’ Stock Review and Free MACD Stock Scan
Which stock may move in the near future and not too distant future? Many may have experienced after you purchased a stock. The stock suddenly stops rally and start dipping. However, the moment you cut loss (sell), the moment you sell the stock, the stock starts to move and move in parabolic manner.
Trader needs a powerful charting software to help in analyse the stock and the market, Moses uses AmiBroker charting software. Moses uses AmiBroker Formula Language, AFL program to scan through Singapore stocks that list in Singapore Stock Exchange, SGX to find stocks have Moving Average Convergence Divergence (MACD) bullish and bearish signals.
Trading indicator is just like traffic light. It gives you early warning on the price direction. However, just like traffic light, sometime it will turn read so the price stop rising or falling.
MACD Indicator gives you the early warning that the stock potentially movement. So the scan help to narrow down the number of stocks you can invest.
May 21 2014 stock benchmark Straits Times Index, STI closed 3261.78 points, STI drops 3.69 points from the last closed of 3265.47 points.
May 21, 2014 Straits Times Index, STI Daily Chart
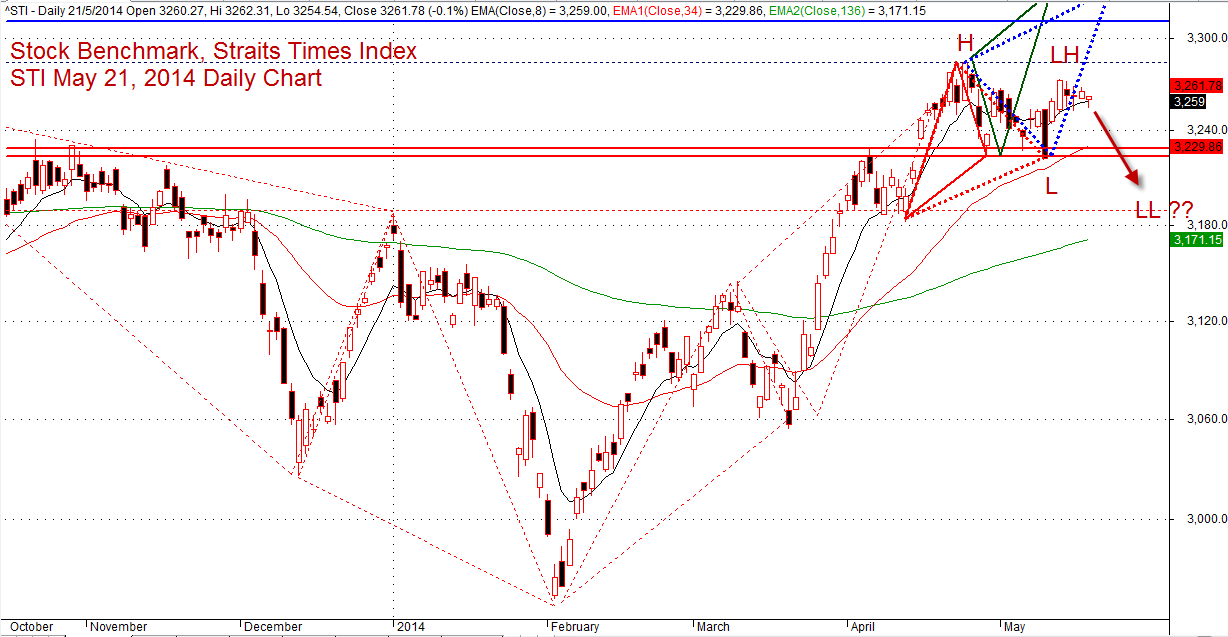
Singapore Stock Benchmark, STI, Straits Times Index Daily Chart May 21, 2014
.
May 21, 2014 Moses Free Stock MACD Scan Results
Free stock market scan results, Moses’ Stock Corner. Moses provides a list of Singapore stocks that have the following MACD signals.
- MACD line crosses above MACD signal – Bullish trend
- MACD line crosses above zero line – Bullish trend
- MACD Histogram +ve Divergence – Bullish trend
- MACD line crosses below MACD signal – Bearish trend
- MACD line crosses below zero line – Bearish trend
- MACD Histogram -ve Divergence – Bearish trend
- Volume traded greater 500,000 shares
Total 75 stocks have MACD bullish and bearish signals, only 41 stocks are traded more than 500,000 shares.
| Ticker | Company | Signals | Close | Vol.(K) | Screening Result |
| Z74 | SINGTEL | Bearish | 3.86 | 15536 | MACD -ve Divergence |
| T82U | SUNTEC REAL ESTATE INV TRUST | Bearish | 1.78 | 10611 | MACD Cross-Down Signal |
| MC0 | GLOBAL LOGISTIC PROP LIMITED | Bearish | 2.8 | 9092 | MACD Cross-Down Signal |
| ME8U | MAPLETREE INDUSTRIAL TRUST | Bearish | 1.47 | 6319 | MACD -ve Divergence |
| N2IU | MAPLETREE COMMERCIAL TRUST | Bearish | 1.325 | 4696 | MACD Cross-Down Signal |
| Y92 | THAI BEVERAGE PUBLIC CO LTD | Bearish | 0.6 | 4035 | MACD Cross-Down Signal |
| K01 | K1 VENTURES LIMITED | Bearish | 0.177 | 3136 | MACD Cross-Down ZeroLine |
| RW0U | MAPLETREE GREATER CHINACOMM TR | Bearish | 0.895 | 2893 | MACD-H -ve Divergence |
| L6T | PSL HOLDINGS LTD. | Bearish | 0.24 | 1875 | MACD Cross-Down ZeroLine |
| U11 | UNITED OVERSEAS BANK LTD | Bearish | 22.45 | 1151 | MACD -ve Divergence |
| K2LU | CACHE LOGISTICS TRUST | Bearish | 1.195 | 1044 | MACD Cross-Down Signal |
| J91U | CAMBRIDGE INDUSTRIAL TRUST | Bearish | 0.76 | 1040 | MACD-H -ve Divergence |
| 5UX | OXLEY HOLDINGS LIMITED | Bearish | 0.775 | 953 | MACD Cross-Down ZeroLine |
| M1Z | TEE INTERNATIONAL LIMITED | Bearish | 0.293 | 806 | MACD-H -ve Divergence |
| U14 | UOL GROUP LIMITED | Bearish | 6.73 | 706 | MACD Cross-Down Signal |
| OU8 | CENTURION CORPORATION LIMITED | Bearish | 0.73 | 655 | MACD Cross-Down Signal |
| MT1 | DRAGON GROUP INTL LIMITED | Bearish | 0.069 | 612 | MACD Cross-Down Signal |
| 5G1 | EUROSPORTS GLOBAL LIMITED | Bearish | 0.27 | 572 | MACD Cross-Down Signal |
| E13 | ELLIPSIZ LTD | Bearish | 0.094 | 525 | MACD-H -ve Divergence |
| L38 | LCD GLOBAL INVESTMENTS LTD. | Bullish | 0.193 | 23139 | MACD Cross-Up Signal |
| Z59 | YOMA STRATEGIC HOLDINGS LTD | Bullish | 0.7 | 12461 | MACD-H +ve Divergence |
| A17U | ASCENDAS REAL ESTATE INV TRUST | Bullish | 2.42 | 7708 | MACD Cross-Up Signal |
| 5DN | EZRA HOLDINGS LIMITED | Bullish | 1.055 | 5422 | MACD Cross-Up Signal |
| T09 | TT INTERNATIONAL LIMITED | Bullish | 0.172 | 5395 | MACD Cross-Up Signal |
| S3N | OKH GLOBAL LTD. | Bullish | 0.57 | 4733 | MACD Cross-Up Signal |
| BS6 | YANGZIJIANG SHIPBLDG HLDGS LTD | Bullish | 1.14 | 4418 | MACD Cross-Up Signal |
| ND8U | FRASERS COMMERCIAL TRUST | Bullish | 1.32 | 3993 | MACD Cross-Up Signal |
| S51 | SEMBCORP MARINE LTD | Bullish | 3.98 | 2916 | MACD Cross-Up Signal |
| U19 | UNITED ENVIROTECH LTD | Bullish | 1.27 | 2326 | MACD Cross-Up Signal |
| J69U | FRASERS CENTREPOINT TRUST | Bullish | 1.85 | 2197 | MACD Cross-Up Signal |
| SV3U | SOILBUILD BUSINESS SPACE REIT | Bullish | 0.785 | 2173 | MACD Cross-Up Signal |
| AU8U | CAPITARETAIL CHINA TRUST | Bullish | 1.535 | 1866 | MACD Cross-Up Signal |
| 5CQ | TECHNICS OIL & GAS LIMITED | Bullish | 0.835 | 1827 | MACD Cross-Up Signal |
| 5TP | CNMC GOLDMINE HOLDINGS LIMITED | Bullish | 0.29 | 1655 | MACD Cross-Up Signal |
| 5VI | LOGISTICS HOLDINGS LIMITED | Bullish | 0.31 | 1568 | MACD Cross-Up Signal |
| 566 | SEE HUP SENG LIMITED | Bullish | 0.305 | 1347 | MACD-H +ve Divergence |
| E28 | FRENCKEN GROUP LIMITED | Bullish | 0.36 | 1029 | MACD Cross-Up ZeroLine |
| C6L | SINGAPORE AIRLINES LTD | Bullish | 10.3 | 942 | MACD Cross-Up Signal |
| CY6U | ASCENDAS INDIA TRUST | Bullish | 0.78 | 902 | MACD Cross-Up ZeroLine |
| P9J | GLOBAL PREMIUM HOTELS LIMITED | Bullish | 0.33 | 683 | MACD Cross-Up Signal |
| W12 | WILLAS-ARRAY ELEC (HLDGS) LTD | Bullish | 0.17 | 627 | MACD Cross-Up Signal |
Moses
DISCLAIMER
Information provided here is of the nature of a general comment only and no intend to be specific for trading advice. It has prepared without regard to any particular investment objectives, financial situation or needs. Information should not be considered as an offer or enticement to buy, sell or trade.
You should seek advice from your broker, or licensed investment advisor, before taking any action.
Once again, the website does not guarantee any results or investment return based on the information and instruction you have read here. It should be used as learning aids only and if you decide to trade real money, all trading decision should be your own.