May 19, 2014
Moses’ Stock Review and Free MACD Stock Scan Results
Which stock may move? Many may experience after you bought the stock. The stock stops rising. The moment you cut loss and sell the stock start to move up again and the worst it move in parabolic manner. You see the money fly away. Sigh!
Trader needs good chart to analyse the market, Moses uses powerful charting software AmiBroker. Moses uses AmiBroker Formula Language, AFL program to scan through Singapore stocks that list in Singapore Stock Exchange, SGX to find stocks have Moving Average Convergence Divergence (MACD) Indicator bullish and bearish signals. It only take less than 10 minutes to scan through nine hundreds plus stock list in SGX. Otherwise, it you take many hours. Assume you take 5 minutes per stock, 900 stocks will take 4500 minutes, it’s equivalent to 75 hours, it’s equal to three plus days. You see the charting tool shall help you to improve your trading ability.
For today as an example, MACD Scan program helps to narrow down to 88 stocks to study. If you only look at stocks that had traded 500K, and only between 50 cents to two dollars it will further reduce to less than 88 stocks. Of course, if you only want to study the top three raise or fall stocks, than you only have six stocks to study. Wow! This can help you reduce your tome from three days to within an hour. Why not take a closer look at the charting software.
Trading indicator is just like traffic light. It gives you warning on the price direction and potential movement. However, it just like traffic light, sometime turns red and sometime continue to stay green.
MACD Indicator gives you the warning like traffic light, so the stock may stop rising or continue the trend or change direction. So the scan results help to narrow down the number of stocks you need to study.
May 19 2014 stock benchmark Straits Times Index, STI closed 3262.43 points, STI dip 0.16 points from last week close of 3262.59 points.
May 19, 2014 Straits Times Index, STI Daily Chart
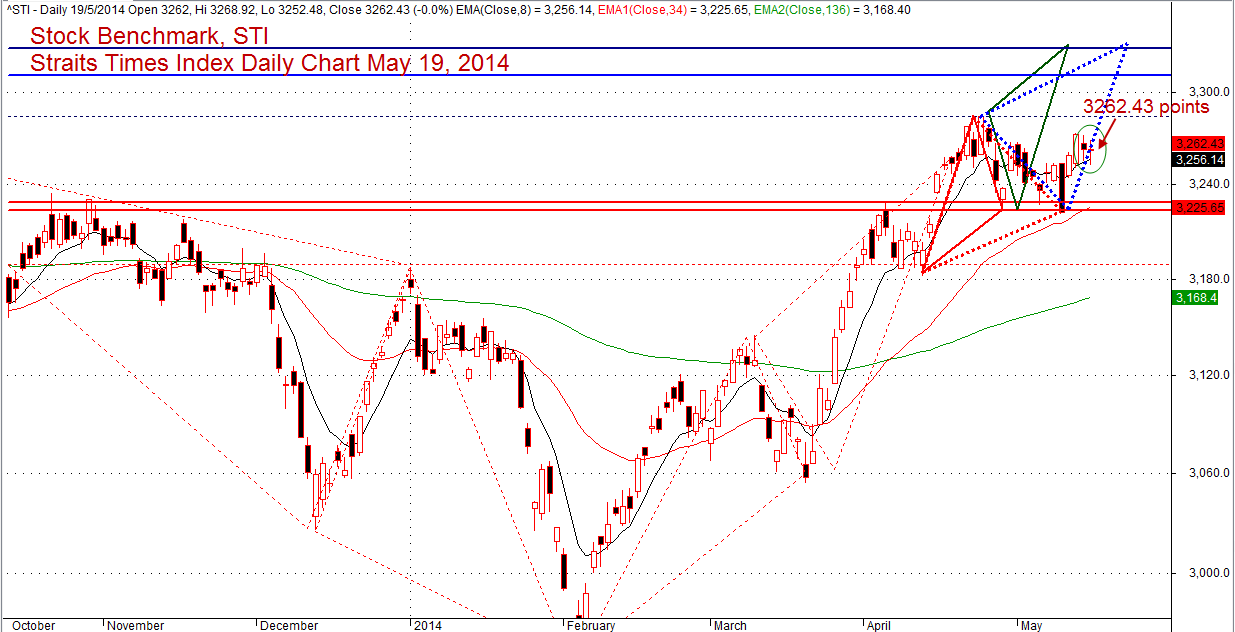
Stock Benchmark, STI, Straits Times Index Daily Chart – May 19, 2014
.
May 19, 2014 Moses Free Stock MACD Scan Results
Free stock market scan results, Moses’ Stock Corner. Moses provides a list of Singapore stocks that have the following MACD signals.
- MACD line crosses above MACD signal – Bullish trend
- MACD line crosses above zero line – Bullish trend
- MACD Histogram +ve Divergence – Bullish trend
- MACD line crosses below MACD signal – Bearish trend
- MACD line crosses below zero line – Bearish trend
- MACD Histogram -ve Divergence – Bearish trend
- Volume traded greater 500,000 shares
Total 88 stocks have MACD bullish and bearish signals, only 40 stocks are traded more than 500,000 shares.
| Ticker | Company | Signal | Close | Vol.(K) | Screening Result |
| JS8 | CAPITAMALLS ASIA LIMITED | Bullish | 2.35 | 201055 | MACD Cross-Up Signal |
| N21 | NOBLE GROUP LIMITED | Bullish | 1.315 | 85818 | MACD Cross-Up Signal |
| F13 | FU YU CORPORATION LTD | Bullish | 0.104 | 55424 | MACD Cross-Up ZeroLine |
| K71U | KEPPEL REIT | Bullish | 1.26 | 8774 | MACD Cross-Up Signal |
| EG0 | JES INTERNATIONAL HOLDINGS LTD | Bullish | 0.074 | 5744 | MACD +ve Divergence |
| 542 | GIKEN SAKATA (S) LIMITED | Bullish | 0.315 | 5064 | MACD Cross-Up Signal |
| E13 | ELLIPSIZ LTD | Bullish | 0.097 | 4709 | MACD Cross-Up Signal |
| C68 | MIRACH ENERGY LIMITED | Bullish | 0.138 | 4246 | MACD Cross-Up Signal |
| P40U | STARHILL GLOBAL REIT | Bullish | 0.83 | 3895 | MACD Cross-Up Signal |
| T35 | SUNNINGDALE TECH LTD | Bullish | 0.162 | 3882 | MACD Cross-Up Signal |
| P15 | PACIFIC CENTURY REGIONAL DEVTS | Bullish | 0.25 | 3560 | MACD Cross-Up Signal |
| B20 | BIOSENSORS INT’L GROUP LTD | Bullish | 0.965 | 3247 | MACD Cross-Up Signal |
| EB5 | FIRST RESOURCES LIMITED | Bullish | 2.58 | 2429 | MACD Cross-Up Signal |
| S7OU | ASIAN PAY TELEVISION TRUST | Bullish | 0.77 | 2093 | MACD Cross-Up Signal |
| D5IU | LIPPO MALLS INDO RETAIL TRUST | Bullish | 0.41 | 1262 | MACD Cross-Up ZeroLine |
| 5TT | KEONG HONG HOLDINGS LIMITED | Bullish | 0.61 | 1243 | MACD Cross-Up Signal |
| E3B | WEE HUR HOLDINGS LTD. | Bullish | 0.35 | 1133 | MACD Cross-Up Signal |
| SK3 | KRISENERGY LTD. | Bullish | 0.705 | 905 | MACD Cross-Up Signal |
| P11 | PACIFIC ANDES RESOURCES DEVLTD | Bullish | 0.118 | 735 | MACD-H +ve Divergence |
| S51 | SEMBCORP MARINE LTD | Bullish | 3.98 | 593 | MACD Cross-Up Signal |
| NO4 | DYNA-MAC HOLDINGS LTD. | Bullish | 0.39 | 563 | MACD Cross-Up Signal |
| 545 | VALLIANZ HOLDINGS LIMITED | Bearish | 0.138 | 18277 | MACD Cross-Down ZeroLine |
| Z74 | SINGTEL | Bearish | 3.84 | 18161 | MACD-H -ve Divergence |
| OJ4 | W CORPORATION LIMITED | Bearish | 0.062 | 16359 | MACD-H -ve Divergence |
| 5F4 | FIGTREE HOLDINGS LIMITED | Bearish | 0.35 | 13201 | MACD Cross-Down Signal |
| N4E | NAM CHEONG LIMITED | Bearish | 0.365 | 12065 | MACD -ve Divergence |
| S21 | GENTING HONG KONG LIMITED | Bearish | 0.39 | 8551 | MACD Cross-Down Signal |
| L6T | PSL HOLDINGS LTD. | Bearish | 0.245 | 5177 | MACD Cross-Down Signal |
| C38U | CAPITAMALL TRUST. | Bearish | 2.03 | 4112 | MACD Cross-Down Signal |
| S53 | SMRT CORPORATION LTD | Bearish | 1.33 | 4067 | MACD -ve Divergence |
| D03 | DEL MONTE PACIFIC LIMITED | Bearish | 0.595 | 3593 | MACD Cross-Down ZeroLine |
| A17U | ASCENDAS REAL ESTATE INV TRUST | Bearish | 2.38 | 3176 | MACD -ve Divergence |
| C61U | CAPITACOMMERCIAL TRUST | Bearish | 1.63 | 2718 | MACD -ve Divergence |
| MS7 | VARD HOLDINGS LIMITED | Bearish | 0.99 | 2578 | MACD Cross-Down Signal |
| S68 | SINGAPORE EXCHANGE LIMITED | Bearish | 6.91 | 1887 | MACD Cross-Down ZeroLine |
| K2LU | CACHE LOGISTICS TRUST | Bearish | 1.2 | 1495 | MACD-H -ve Divergence |
| T39 | SINGAPORE PRESS HLDGS LTD | Bearish | 4.24 | 1316 | MACD -ve Divergence |
| 5CQ | TECHNICS OIL & GAS LIMITED | Bearish | 0.815 | 937 | MACD Cross-Down Signal |
| 5TP | CNMC GOLDMINE HOLDINGS LIMITED | Bearish | 0.275 | 917 | MACD Cross-Down Signal |
| M35 | WHEELOCK PROPERTIES (S) LTD | Bearish | 1.8 | 511 | MACD Cross-Down ZeroLine |
Moses
DISCLAIMER
Information provided here is of the nature of a general comment only and no intend to be specific for trading advice. It has prepared without regard to any particular investment objectives, financial situation or needs. Information should not be considered as an offer or enticement to buy, sell or trade.
You should seek advice from your broker, or licensed investment advisor, before taking any action.
Once again, the website does not guarantee any results or investment return based on the information and instruction you have read here. It should be used as learning aids only and if you decide to trade real money, all trading decision should be your own.