17 May, 2018
Thank you for visiting the site. Hope you like the content.
Rowsley Charting
Think think got more things. Trade with eyes open. Manage your risk.
Not to Talk Bad about this Stock, just to share my experience.
At one time, i was crazy. I went into the market to buy the penny stocks. This is really mad, as these stocks are very difficult to turn around. So I wasted all the fund. Is like drop them in a bottomless well. If you can recover your fund. It is very miracle.
Of course you see some penny stock suddenly shoot up twenty thirty times, these are being speculated. If it happen to you, you are luckier man in the world.
Most of the time, my was get delisted.
Watch your trade plan.

May 16, 2018 Rowsley Charting
Free MACD Scan One-day Singapore Stock MACD Screening Results on May 16 2018
Remember all setup can fail. This is true for all indicators. It is also true for MACD signals setup. See some of the MACD setup fail examples on this website.
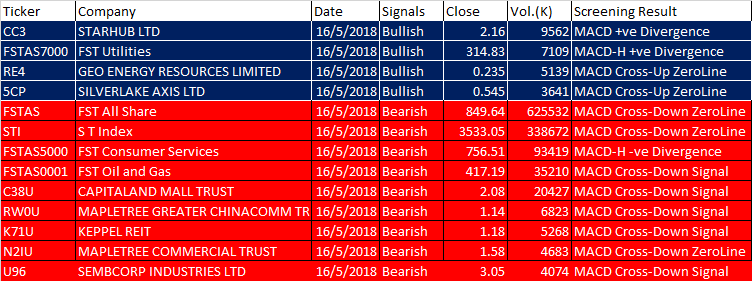
May 16, 2018 Singapore Stock 1-Day MACD Screening Signals
These are the six types of MACD Signals:
- MACD line crosses above MACD signal – Bullish trend
- MACD line crosses above zero line – Bullish trend
- MACD Histogram +ve Divergence – Bullish trend
- MACD line crosses below MACD signal – Bearish trend
- MACD line crosses below zero line – Bearish trend
- MACD Histogram -ve Divergence – Bearish trend
| Ticker | Company | Date | Signals | Close | Vol.(K) | Screening Result |
| CC3 | STARHUB LTD | 16/5/2018 | Bullish | 2.16 | 9562 | MACD +ve Divergence |
| FSTAS7000 | FST Utilities | 16/5/2018 | Bullish | 314.83 | 7109 | MACD-H +ve Divergence |
| RE4 | GEO ENERGY RESOURCES LIMITED | 16/5/2018 | Bullish | 0.235 | 5139 | MACD Cross-Up ZeroLine |
| 5CP | SILVERLAKE AXIS LTD | 16/5/2018 | Bullish | 0.545 | 3641 | MACD Cross-Up ZeroLine |
| FSTAS | FST All Share | 16/5/2018 | Bearish | 849.64 | 625532 | MACD Cross-Down ZeroLine |
| STI | S T Index | 16/5/2018 | Bearish | 3533.05 | 338672 | MACD Cross-Down ZeroLine |
| FSTAS5000 | FST Consumer Services | 16/5/2018 | Bearish | 756.51 | 93419 | MACD-H -ve Divergence |
| FSTAS0001 | FST Oil and Gas | 16/5/2018 | Bearish | 417.19 | 35210 | MACD Cross-Down Signal |
| C38U | CAPITALAND MALL TRUST | 16/5/2018 | Bearish | 2.08 | 20427 | MACD Cross-Down Signal |
| RW0U | MAPLETREE GREATER CHINACOMM TR | 16/5/2018 | Bearish | 1.14 | 6823 | MACD Cross-Down Signal |
| K71U | KEPPEL REIT | 16/5/2018 | Bearish | 1.18 | 5268 | MACD Cross-Down Signal |
| N2IU | MAPLETREE COMMERCIAL TRUST | 16/5/2018 | Bearish | 1.58 | 4683 | MACD Cross-Down ZeroLine |
| U96 | SEMBCORP INDUSTRIES LTD | 16/5/2018 | Bearish | 3.05 | 4074 | MACD Cross-Down Signal |
Moses Singapore Stock Scan
AmiBroker Academy.com
Disclaimer:
The above result is for illustration purpose. It is not meant to be used for buy or sell decision. We do not recommend any particular stocks. If particular stocks of such are mentioned, they are meant as demonstration of Amibroker as a powerful charting software and MACD. Amibroker can program to scan the stocks for buy and sell signals.
These are script generated signals. Not all scan results are shown here. The MACD signal should use with price action. Users must understand what MACD and price action are all about before using them. If necessary you should attend a course to learn more on Technical Analysis (TA) and Moving Average Convergence Divergence, MACD.
Once again, the website does not guarantee any results or investment return based on the information and instruction you have read here. It should be used as learning aids only and if you decide to trade real money, all trading decision should be your own.