12 May, 2018
Thank you for visiting the site. Hope you like the content.
Chart Stories for Dow
^DJI Dow Jones Industrial Average and MA Wave
Moving Average is a great visual tool for technical analysis on bullish or bearish trend. See chart the index was bullish; stay above the MA and in 2018 the price action close below MA, and resisted by MA. The trend start to reverse. Manage your risk.
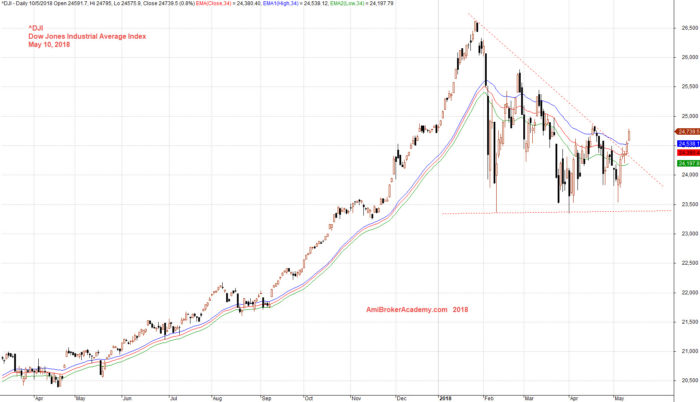
May 10, 2018 Dow Jones Industrial Average Index and MA Wave
Dow Jones Industrial Average and Volatility Index Correlation
Picture worth a thousand words, see chart on the current market fear. Manage your risk.
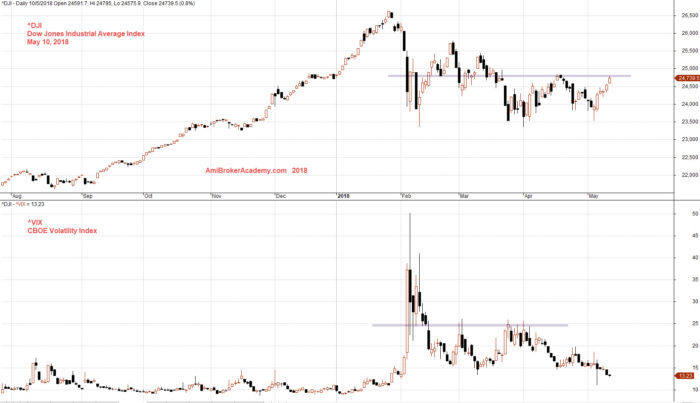
May 10, 2018 Dow Index and Volatility Index Correlation
Free MACD Scan One-day US Stock MACD Screening Results on May 10 2018
Remember all setup can fail. This is true for all indicators. It is also true for MACD signals setup. See some of the MACD setup fail examples on this website.
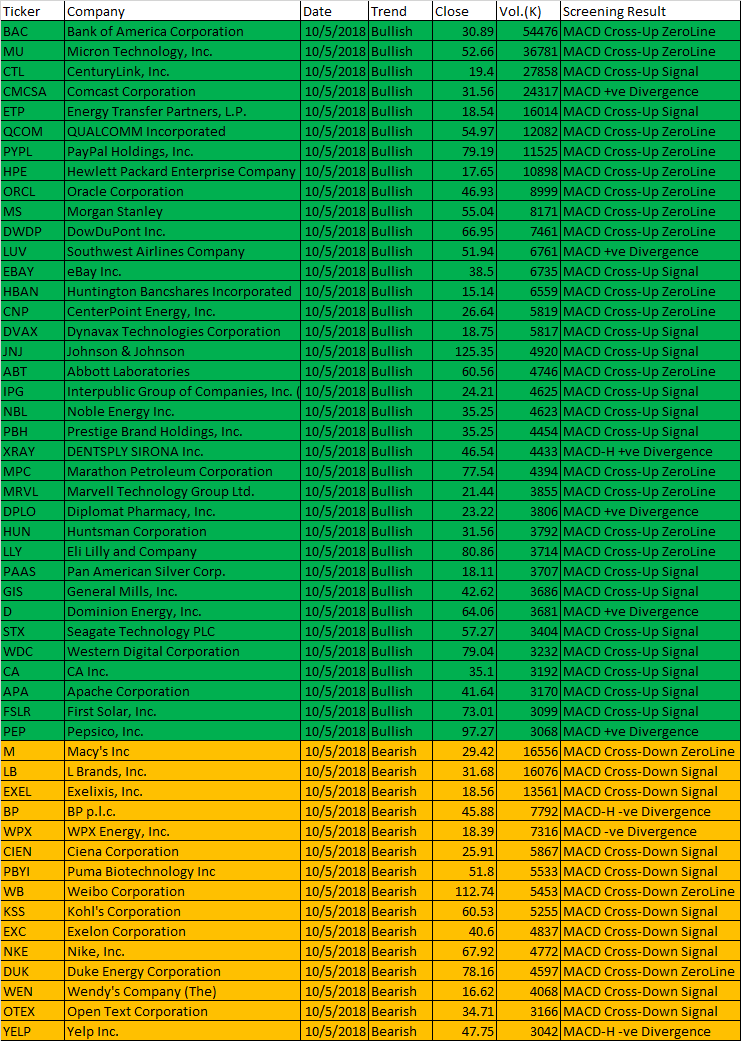
May 10, 2018 US Stock One-day MACD Scan Signals
These are the six types of MACD Signals:
- MACD line crosses above MACD signal – Bullish trend
- MACD line crosses above zero line – Bullish trend
- MACD Histogram +ve Divergence – Bullish trend
- MACD line crosses below MACD signal – Bearish trend
- MACD line crosses below zero line – Bearish trend
- MACD Histogram -ve Divergence – Bearish trend
| Ticker | Company | Date | Trend | Close | Vol.(K) | Screening Result |
| BAC | Bank of America Corporation | 10/5/2018 | Bullish | 30.89 | 54476 | MACD Cross-Up ZeroLine |
| MU | Micron Technology, Inc. | 10/5/2018 | Bullish | 52.66 | 36781 | MACD Cross-Up ZeroLine |
| CTL | CenturyLink, Inc. | 10/5/2018 | Bullish | 19.4 | 27858 | MACD Cross-Up Signal |
| CMCSA | Comcast Corporation | 10/5/2018 | Bullish | 31.56 | 24317 | MACD +ve Divergence |
| ETP | Energy Transfer Partners, L.P. | 10/5/2018 | Bullish | 18.54 | 16014 | MACD Cross-Up Signal |
| QCOM | QUALCOMM Incorporated | 10/5/2018 | Bullish | 54.97 | 12082 | MACD Cross-Up ZeroLine |
| PYPL | PayPal Holdings, Inc. | 10/5/2018 | Bullish | 79.19 | 11525 | MACD Cross-Up ZeroLine |
| HPE | Hewlett Packard Enterprise Company | 10/5/2018 | Bullish | 17.65 | 10898 | MACD Cross-Up ZeroLine |
| ORCL | Oracle Corporation | 10/5/2018 | Bullish | 46.93 | 8999 | MACD Cross-Up ZeroLine |
| MS | Morgan Stanley | 10/5/2018 | Bullish | 55.04 | 8171 | MACD Cross-Up ZeroLine |
| DWDP | DowDuPont Inc. | 10/5/2018 | Bullish | 66.95 | 7461 | MACD Cross-Up ZeroLine |
| LUV | Southwest Airlines Company | 10/5/2018 | Bullish | 51.94 | 6761 | MACD +ve Divergence |
| EBAY | eBay Inc. | 10/5/2018 | Bullish | 38.5 | 6735 | MACD Cross-Up Signal |
| HBAN | Huntington Bancshares Incorporated | 10/5/2018 | Bullish | 15.14 | 6559 | MACD Cross-Up ZeroLine |
| CNP | CenterPoint Energy, Inc. | 10/5/2018 | Bullish | 26.64 | 5819 | MACD Cross-Up ZeroLine |
| DVAX | Dynavax Technologies Corporation | 10/5/2018 | Bullish | 18.75 | 5817 | MACD Cross-Up Signal |
| JNJ | Johnson & Johnson | 10/5/2018 | Bullish | 125.35 | 4920 | MACD Cross-Up Signal |
| ABT | Abbott Laboratories | 10/5/2018 | Bullish | 60.56 | 4746 | MACD Cross-Up ZeroLine |
| IPG | Interpublic Group of Companies, Inc. (The) | 10/5/2018 | Bullish | 24.21 | 4625 | MACD Cross-Up Signal |
| NBL | Noble Energy Inc. | 10/5/2018 | Bullish | 35.25 | 4623 | MACD Cross-Up Signal |
| PBH | Prestige Brand Holdings, Inc. | 10/5/2018 | Bullish | 35.25 | 4454 | MACD Cross-Up Signal |
| XRAY | DENTSPLY SIRONA Inc. | 10/5/2018 | Bullish | 46.54 | 4433 | MACD-H +ve Divergence |
| MPC | Marathon Petroleum Corporation | 10/5/2018 | Bullish | 77.54 | 4394 | MACD Cross-Up ZeroLine |
| MRVL | Marvell Technology Group Ltd. | 10/5/2018 | Bullish | 21.44 | 3855 | MACD Cross-Up ZeroLine |
| DPLO | Diplomat Pharmacy, Inc. | 10/5/2018 | Bullish | 23.22 | 3806 | MACD +ve Divergence |
| HUN | Huntsman Corporation | 10/5/2018 | Bullish | 31.56 | 3792 | MACD Cross-Up ZeroLine |
| LLY | Eli Lilly and Company | 10/5/2018 | Bullish | 80.86 | 3714 | MACD Cross-Up ZeroLine |
| PAAS | Pan American Silver Corp. | 10/5/2018 | Bullish | 18.11 | 3707 | MACD Cross-Up Signal |
| GIS | General Mills, Inc. | 10/5/2018 | Bullish | 42.62 | 3686 | MACD Cross-Up Signal |
| D | Dominion Energy, Inc. | 10/5/2018 | Bullish | 64.06 | 3681 | MACD +ve Divergence |
| STX | Seagate Technology PLC | 10/5/2018 | Bullish | 57.27 | 3404 | MACD Cross-Up Signal |
| WDC | Western Digital Corporation | 10/5/2018 | Bullish | 79.04 | 3232 | MACD Cross-Up Signal |
| CA | CA Inc. | 10/5/2018 | Bullish | 35.1 | 3192 | MACD Cross-Up Signal |
| APA | Apache Corporation | 10/5/2018 | Bullish | 41.64 | 3170 | MACD Cross-Up Signal |
| FSLR | First Solar, Inc. | 10/5/2018 | Bullish | 73.01 | 3099 | MACD Cross-Up Signal |
| PEP | Pepsico, Inc. | 10/5/2018 | Bullish | 97.27 | 3068 | MACD +ve Divergence |
| M | Macy’s Inc | 10/5/2018 | Bearish | 29.42 | 16556 | MACD Cross-Down ZeroLine |
| LB | L Brands, Inc. | 10/5/2018 | Bearish | 31.68 | 16076 | MACD Cross-Down Signal |
| EXEL | Exelixis, Inc. | 10/5/2018 | Bearish | 18.56 | 13561 | MACD Cross-Down Signal |
| BP | BP p.l.c. | 10/5/2018 | Bearish | 45.88 | 7792 | MACD-H -ve Divergence |
| WPX | WPX Energy, Inc. | 10/5/2018 | Bearish | 18.39 | 7316 | MACD -ve Divergence |
| CIEN | Ciena Corporation | 10/5/2018 | Bearish | 25.91 | 5867 | MACD Cross-Down Signal |
| PBYI | Puma Biotechnology Inc | 10/5/2018 | Bearish | 51.8 | 5533 | MACD Cross-Down Signal |
| WB | Weibo Corporation | 10/5/2018 | Bearish | 112.74 | 5453 | MACD Cross-Down ZeroLine |
| KSS | Kohl’s Corporation | 10/5/2018 | Bearish | 60.53 | 5255 | MACD Cross-Down Signal |
| EXC | Exelon Corporation | 10/5/2018 | Bearish | 40.6 | 4837 | MACD Cross-Down Signal |
| NKE | Nike, Inc. | 10/5/2018 | Bearish | 67.92 | 4772 | MACD Cross-Down Signal |
| DUK | Duke Energy Corporation | 10/5/2018 | Bearish | 78.16 | 4597 | MACD Cross-Down ZeroLine |
| WEN | Wendy’s Company (The) | 10/5/2018 | Bearish | 16.62 | 4068 | MACD Cross-Down Signal |
| OTEX | Open Text Corporation | 10/5/2018 | Bearish | 34.71 | 3166 | MACD Cross-Down Signal |
| YELP | Yelp Inc. | 10/5/2018 | Bearish | 47.75 | 3042 | MACD-H -ve Divergence |
Have fun! Reader must understand what MACD is all about before using the results.
Moses US Stock Scan
AmiBroker Academy.com
Disclaimer:
The above result is for illustration purpose. It is not meant to be used for buy or sell decision. We do not recommend any particular stocks. If particular stocks of such are mentioned, they are meant as demonstration of Amibroker as a powerful charting software and MACD. Amibroker can program to scan the stocks for buy and sell signals.
These are script generated signals. Not all scan results are shown here. The MACD signal should use with price action. Users must understand what MACD and price action are all about before using them. If necessary you should attend a course to learn more on Technical Analysis (TA) and Moving Average Convergence Divergence, MACD.
Once again, the website does not guarantee any results or investment return based on the information and instruction you have read here. It should be used as learning aids only and if you decide to trade real money, all trading decision should be your own.