With the Supper Committee still could not come to an agreement on the 1.2 trillion cuts. Plus the Europe zone crisis round the corner and rising concern on global recession. Asia markets has be affected, there is no different for Singapore Stocks Markets.
After the investors bargain hunt for a day, stocks could look cheap could be cheaper. Singapore stocks index, Straits Times Index (or STI) has close lower at 2676.57. It’s down 40.63 points from November 22 closed. The market remain soft.
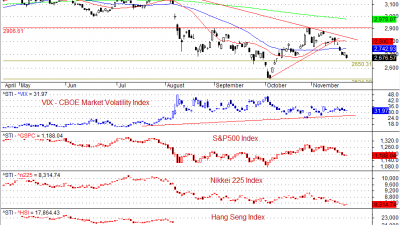
Compare STI with Nikkei 225, Hang Seng Index, S&P500 and VIX. It has great correlation. Asia markets are influenced by US market.
VIX is Market Volatility Index. It is a Chicago Board Options Exchange index. A popular measure of the implied volatility of S&P 500 index. It is also referred to as the fear index.
Using MACD scanner, find the following 13 Singapore stocks closed November 23 with the value greater than $1 and have the volume greater than 100 K showing MACD High Probability trade signals.
MACD makes up of 2 lines, the MACD Line and MACD Signal Line. MACD helps to spotting early trend change such as early bullish or bearish trade signal. However, need to confirm the signal with price action. MACD common setting is (12,26,9)
| Ticker | Type | Close | Vol.(K) | Screening Result |
| Z25 | bearish |
1.08 |
8927 |
MACD Cross-Down Signal |
| C38U | bearish |
1.73 |
6924 |
MACD Cross-Down Signal |
| D05 | bearish |
12.09 |
5406 |
MACD Cross-Down ZeroLine |
| BN4 | bearish |
8.93 |
5279 |
MACD Cross-Down ZeroLine |
| S63 | bullish |
2.73 |
2409 |
MACD-H +ve Divergence |
| B2F | bearish |
2.43 |
710 |
MACD Cross-Down Signal |
| S58 | bearish |
2.25 |
521 |
MACD Cross-Down ZeroLine |
| S10 | bullish |
1.51 |
364 |
MACD Cross-Up Signal |
| C07 | bearish |
44.16 |
212 |
MACD Cross-Down ZeroLine |
| U10 | bearish |
1.515 |
208 |
MACD Cross-Down ZeroLine |
| R01 | bullish |
2.2 |
182 |
MACD Cross-Up Signal |
| J37 | bearish |
29 |
144 |
MACD Cross-Down ZeroLine |
| X04 | bearish |
1.195 |
117 |
MACD Cross-Down ZeroLine |
Disclaimer
The above result is for illustration purpose. It is not meant to be used for buy or sell decision. We do not recommend any particular stocks. If particular stocks of such are mentioned, they are meant as demonstration of Amibroker as a powerful charting software and MACD characteristics. Amibroker can program to scan the stocks for buy and sell signals.
These are script generated signals. Not all scan results are shown here. The MACD signal should use with price action. Users must understand what MACD and price action are all about before using them. If necessary you should attend a course to learn more on Technical Analysis (TA) and Moving Average Convergence Divergence, MACD.
Once again, the website does not guarantee any results or investment return based on the information and instruction you have read here.