Daily Singapore shares market scan, using MACD Scanner, the MACD scanner has picked 7 EOD stocks on December 6, 2011 that passed the scan criteria for volume exceeding 100K and price closed above $1. Out of 7 stocks 6 stocks were bullish, and 1 stock was bearish. Even when Straits Times shares market benchmark, Straits Times Index, STI is closed another 16.99 points lower than last closed.
Straits Times Index
O = 2757.88 (open)
C= 2749.24 (close)
H = 2759.89 (high)
L = 2736.09 (low)
The following are the seven stocks.
| Company | type | Close | Vol.(K) | Screening Result |
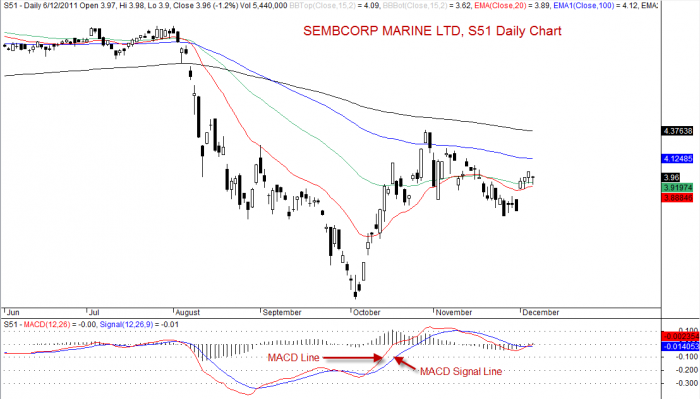
| SEMBCORP MARINE LTD | bullish |
3.96 |
5440 |
MACD Cross-Up ZeroLine |
| SINGAPORE TECH ENGINEERING LTD | bullish |
2.86 |
3361 |
MACD Cross-Up ZeroLine |
| SATS LTD. | bullish |
2.19 |
899 |
MACD Cross-Up Signal |
| INDOFOOD AGRI RESOURCES LTD. | bullish |
1.335 |
771 |
MACD Cross-Up ZeroLine |
| PARKWAYLIFE REIT | bullish |
1.805 |
377 |
MACD Cross-Up ZeroLine |
| ASCOTT RESIDENCE TRUST | bullish |
1 |
234 |
MACD Cross-Up Signal |
| RAFFLES MEDICAL GROUP LTD | bearish |
2.15 |
192 |
MACD Cross-Down ZeroLine |
Moving Average Convergence Divergence, MACD
MACD, Moving Average Convergence Divergence can be used as a trend following tool and a momentum indicator. It shows acceleration and deceleration of a trend. It is also useful for spotting major trend reversal.
MACD oscillates above and below zero without any upper or lower limits.
MACD makes up of 2 lines. The MACD line (red line) and MACD signal line (blue line). The MACD line and signal line will cross up and down of the zero line.
When the MACD lien crosses over the MACD signal line the trend is bullish. When the MACD line crosses below the MACD signal line the trend is bearish.
When the MACD line crosses above zero line the trend is bullish. When the MACD line crosses below zero line the trend is bearish.
Disclaimer
The above result is for illustration purpose. It is not meant to be used for buy or sell decision. We do not recommend any particular stocks. If particular stocks of such are mentioned, they are meant as demonstration of Amibroker as a powerful charting software and MACD characteristics. Amibroker can program to scan the stocks for buy and sell signals.
These are script generated signals. Not all scan results are shown here. The MACD signal should use with price action. Users must understand what MACD and price action are all about before using them. If necessary you should attend a course to learn more on Technical Analysis (TA) and Moving Average Convergence Divergence, MACD.
Once again, the website does not guarantee any results or investment return based on the information and instruction you have read here.