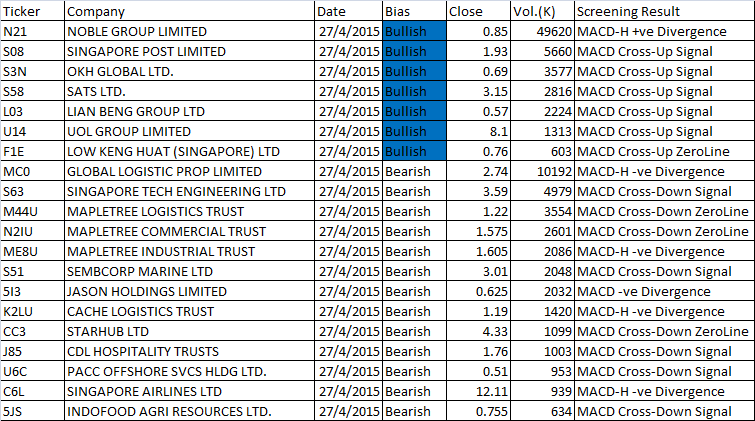
April 27 2015 Stock Scan Results
Free Moses’ Singapore Stocks MACD Scan for Singapore Stocks closed fifty (50) cents or more and have 500,000 or more shares changing hand on April 27, 2015.
MACD, Moving Average Convergence Divergence
MACD is a popular trend following momentum indicator that shows the relationship of two moving averages of price action; the MACD line and signal line.
MACD provides an early warning that the particular stock may change in direction through 1) Crossovers, 2) Divergence, 3) Cross Zeroline, and 4) Dramatic rise or fall.
But confirmation is important. Have you experienced lighting and hear thunder but not raining? Sure! So only until the rain drops falling on your head then it is confirmed raining. Confirmation is very important! Very important! In trading, there are many whipsaw!
MACD Scan Results Have the Following
- MACD line crosses above MACD signal – Bullish trend
- MACD line crosses above zero line – Bullish trend
- MACD Histogram +ve Divergence – Bullish trend
- MACD line crosses below MACD signal – Bearish trend
- MACD line crosses below zero line – Bearish trend
- MACD Histogram -ve Divergence – Bearish trend
Thanks for visiting the website.
Moses
DISCLAIMER
Site advice, “Stock trading is not a get rich quick scheme and it is high risk”.
Information provided here is of the nature of a general comment only and no intend to be specific for trading advice. It has prepared without regard to any particular investment objectives, financial situation or needs. Information should NOT be considered as an offer or enticement to buy, sell or trade.
You should seek advice from your broker, or licensed investment advisor, before taking any action.
The website does not guarantee any results or investment return based on the information and instruction you have read here. It should be used as learning aids.