August 29, 2016
Yoma Strategic Holdings Stock Chart
Another MACD convergence example, bullish MACD convergence, as said before MACD is a leading indicator. Bullish Convergence signal there is a possible change in direction, from bearish to bullish. However, it is just like traffic light, when you see the traffic light you may not have to stop your car, as the light is green. Likewise, when there is a bullish convergence the price will take a bit of time to turn around.
Pullback
This is more than a pullback, the last high, is higher than the last high. It is likely a reversal. The last high retest the 2015 level.
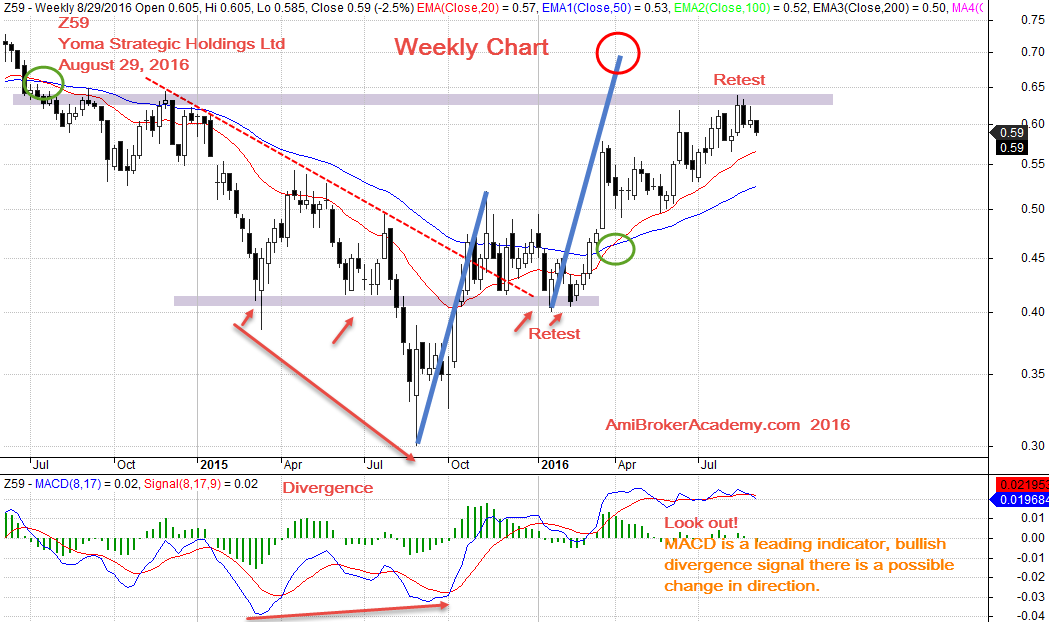
August 29, 2016 Yoma Strategic Holdings Weekly Chart
Moses Stock Column
AmiBrokerAcademy.com
Disclaimer: All information, data and material contained, presented, or provided on amibrokeracademy.com is for educational purposes only. It is not to be construed or intended as providing trading or legal advice. Decisions you make about your trading or investment are important to you and your family, therefore should be made in consultation with a competent financial advisor or professional. We are not financial advisor and do not claim to be. Any views expressed here-in are not necessarily those held by amibrokeracademy.com. You are responsible for your trade decision and wealth being.