15 October 2016
We do not recommending anything
We do not recommending anything. Just passing along what we have found what works.
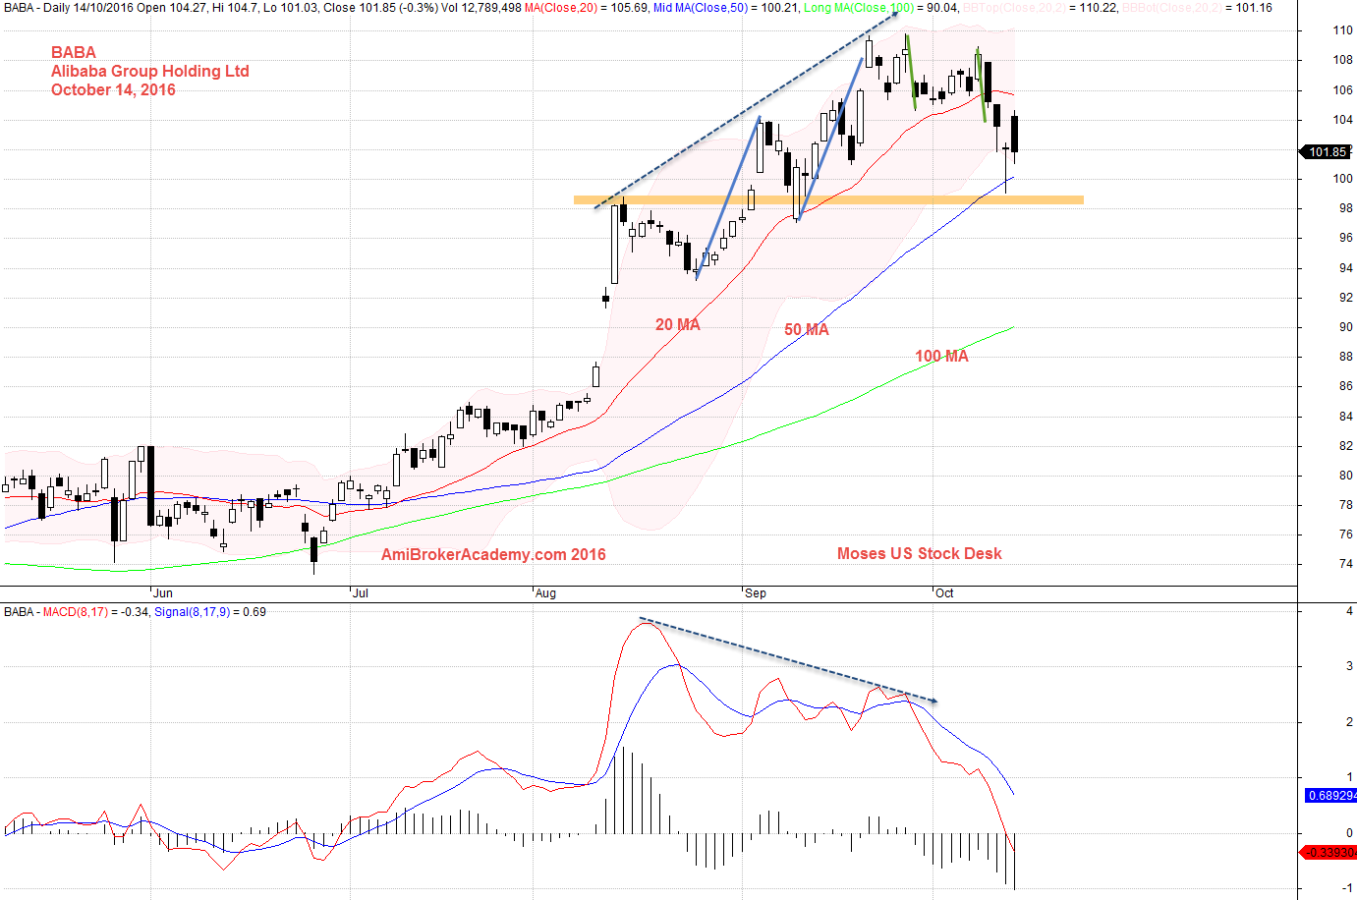
BABA | Alibaba Group Holding Charting and MACD
We can easily spot the ABCD Chart pattern. 20 MA going flat and bending down. Price cross below 20 MA and tested 50 MA and get supported.
Check MACD signals, we see MACD Cross-Down Signal much earlier and now MACD Cross Below ZeroLine.
The stock is topping. Will see.

14 October 2016 Alibaba Group Holding Stock Analysis
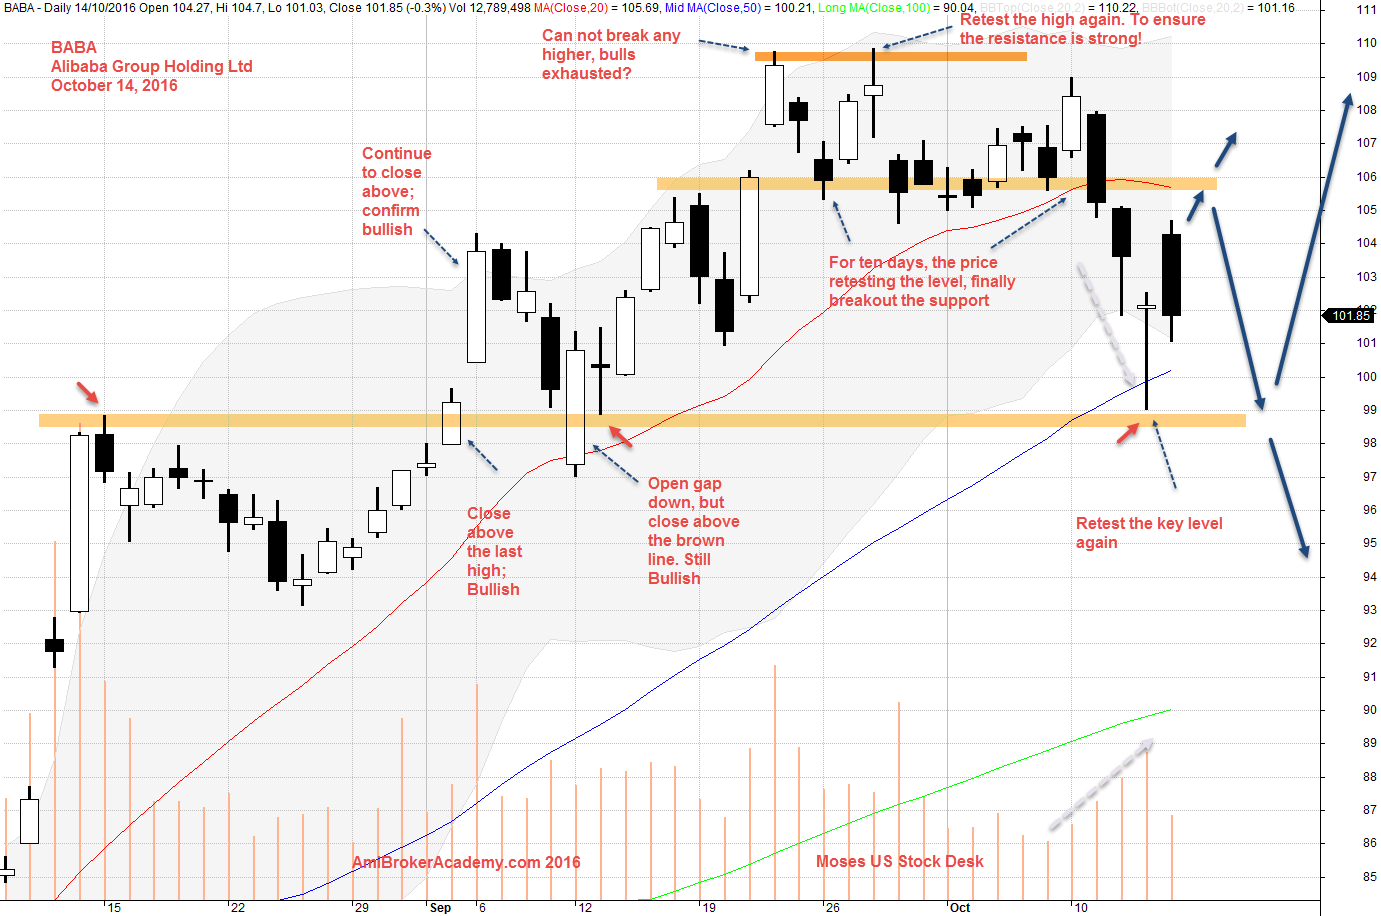
Reading Bar By Bar – BABA Charting
See the chart below with volume, if the bar continue to go lower, lower than the last high that confirmed the bullish trend (lower brown line), the trend will be bearish.

October 14, 2016 Alibaba Group Holding, BABA Charting on Reading Bar by Bar
Have fun!
Moses US Stock Desk
AmiBrokerAcademy.com
Disclaimer: All information, data and material contained, presented, or provided on amibrokeracademy.com is for educational purposes only. It is not to be construed or intended as providing trading or legal advice. Decisions you make about your trading or investment are important to you and your family, therefore should be made in consultation with a competent financial advisor or professional. We are not financial advisor and do not claim to be. Any views expressed here-in are not necessarily those held by amibrokeracademy.com. You are responsible for your trade decision and wealth being.
