28 August, 2018
Second in the series on Market Cycles.
The posting here, may be the only publish up to date trend cycle. You could find many publications on this subject.
Thanks for visiting the site.
Stock market cycles are measured over different time horizons. It can be short-term, or long-term. The cycles can last from two years to many years. Any many view the stock market cycles is closely related to economic cycles. This are true only until proven wrong. This is no different from all stock setup, the setup are always true till the setup fail.
It will take us a number of posting to study the cycles. We begin from now and look left. We will begin to study Dow Index. Have fun.
^DJI Dow Jones Industrial Average Index Charting
See chart, continue to look left after the bull cycle, picture worth a thousand words. October 11 2007 to March 6 2009 a bear market cycle.
Continue to look left to see the start point of the bull trend, see the next chart.
Manage your risk.
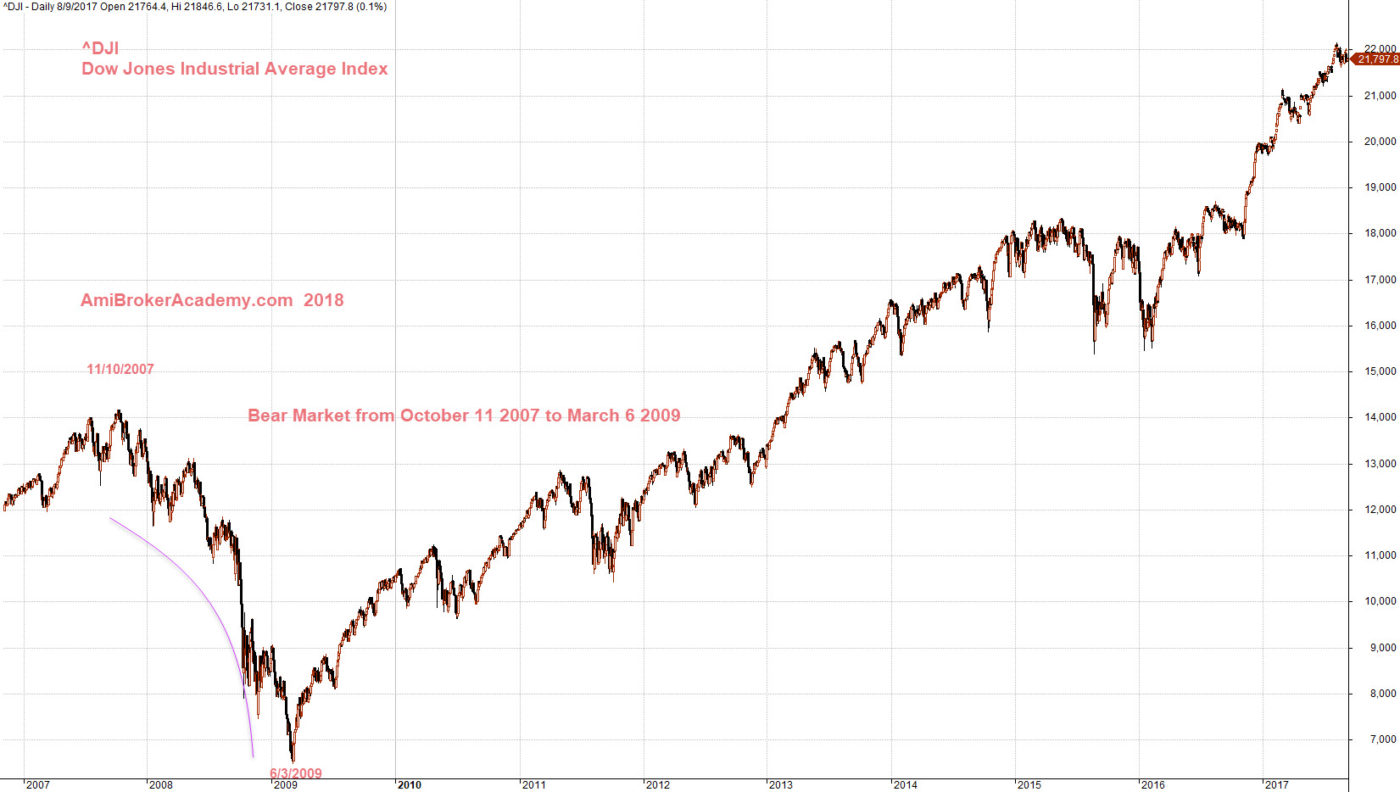
Dow Jones Industrail Average Index -October 11 2008 to March 6 2009 Bear Trend
Bull Cycle From 2009 till 2018 – March 6 2009 to January 26 2018
Picture worth a thousand words, March 6, 2018 is the starting point of bull trend, the current bull trend.
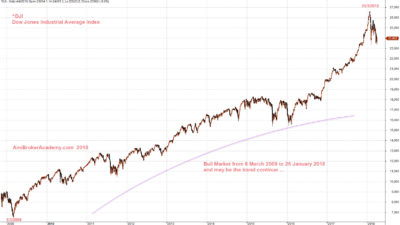
Dow Jones Industrail Average Index – March 6 2009 to January 26 2018 Bull Trend
Moses US Stock Chart Analysis
AmiBrokerAcademy.com
Disclaimer
The above result is for illustration purpose. It is not meant to be used for buy or sell decision. We do not recommend any particular stocks. If particular stocks of such are mentioned, they are meant as demonstration of Amibroker as a powerful charting software and MACD. Amibroker can program to scan the stocks for buy and sell signals.
These are script generated signals. Not all scan results are shown here. The MACD signal should use with price action. Users must understand what MACD and price action are all about before using them. If necessary you should attend a course to learn more on Technical Analysis (TA) and Moving Average Convergence Divergence, MACD.
Once again, the website does not guarantee any results or investment return based on the information and instruction you have read here. It should be used as learning aids only and if you decide to trade real money, all trading decision should be your own.