December 29 2020
Welcome to AmiBroker Academy dot com. Thanks for searching and landed here. Our organic search rating has declined from 150k, 160k till now, Alexa do not even give any rating. Sure things have changed, but can believe this just happened over the last six months, or less. We must have done something really do not attract eyeball anymore. Well, we will try again, do something different and see when can we go back to our past nice rating. Have fun!
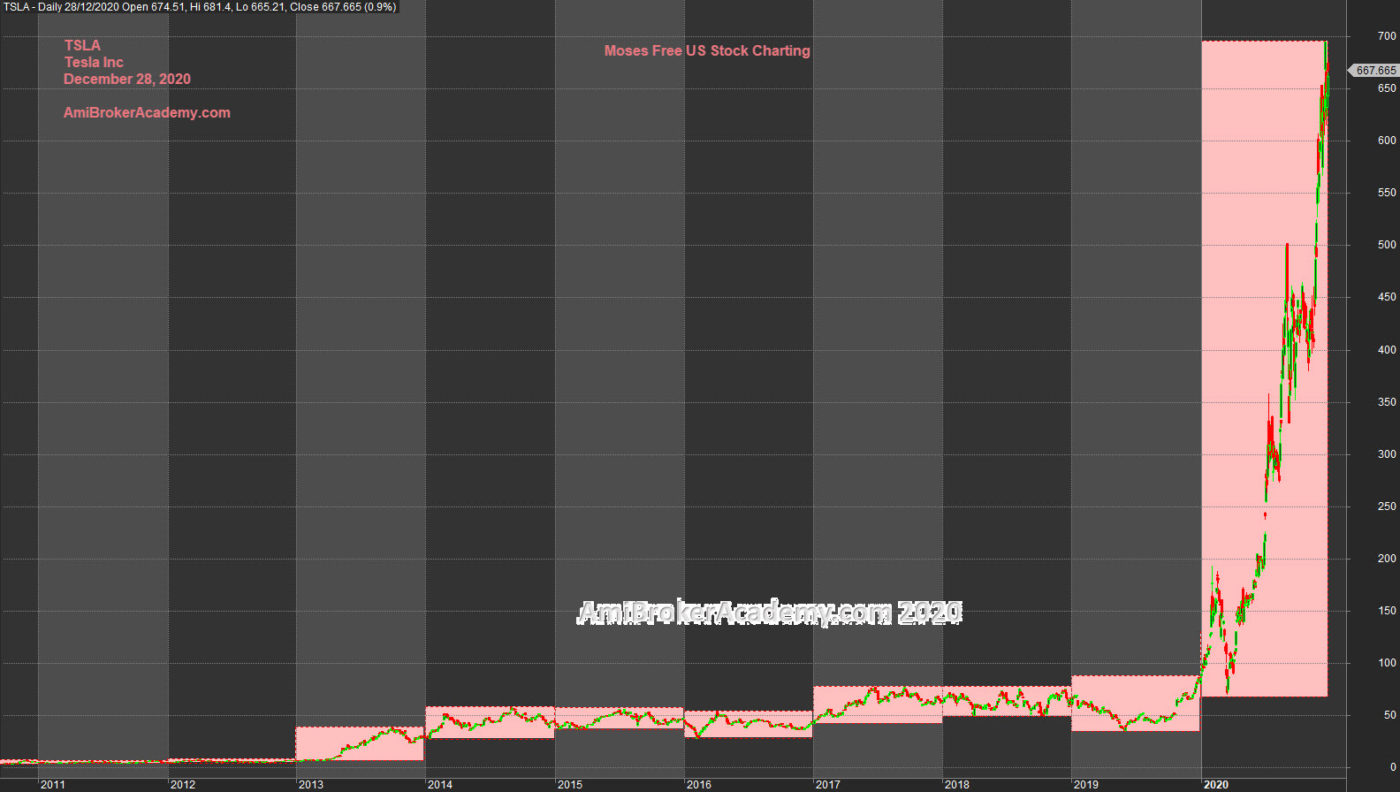
TSLA | Tesla Inc Stock Charting From 2011
Box is a great way to quick view the period high low, such as week, month, quarter or year.
Picture worth a thousand words, see chart. Price Action shot up in 2020 after stock split. If not, the price action may be different.
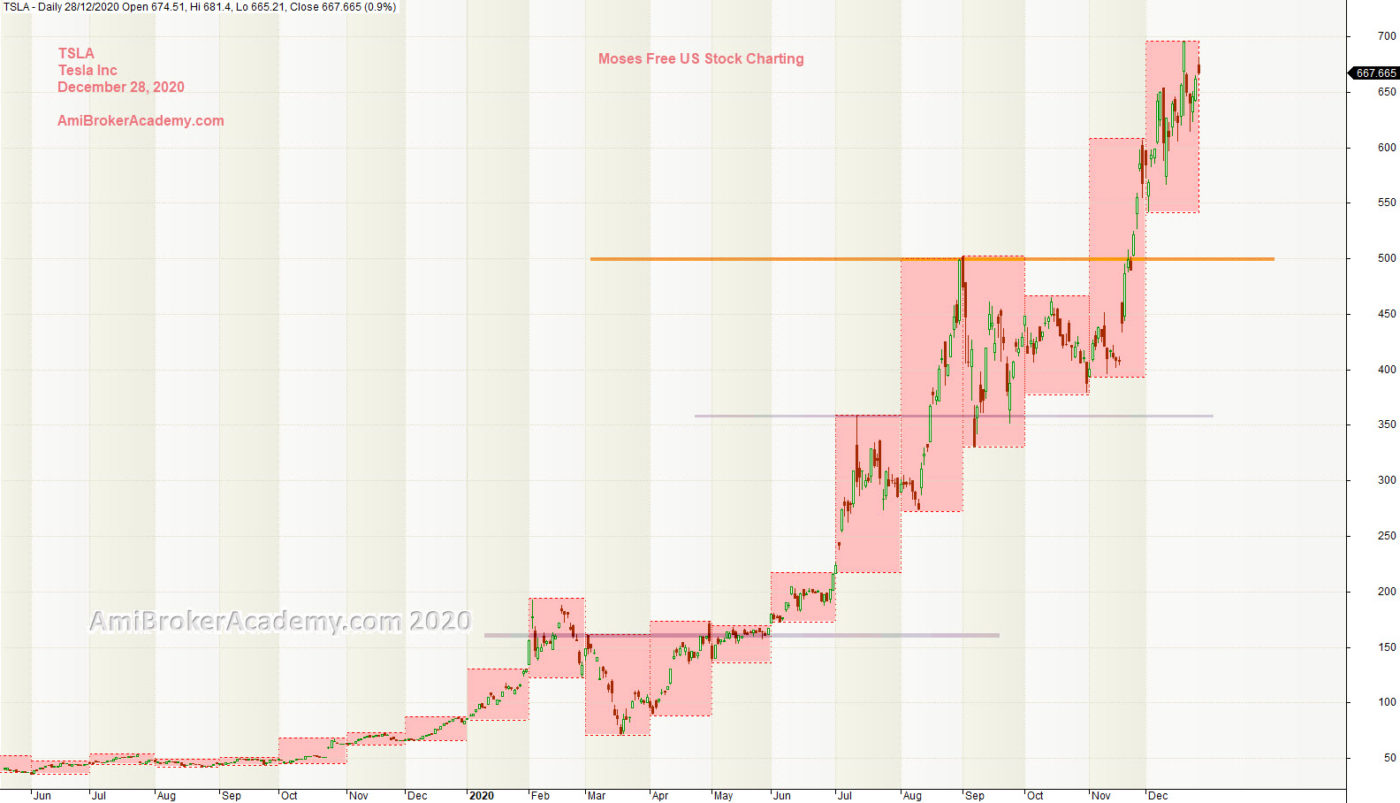
TSLA | Tesla Inc Stock Charting for Past Eighteen Months
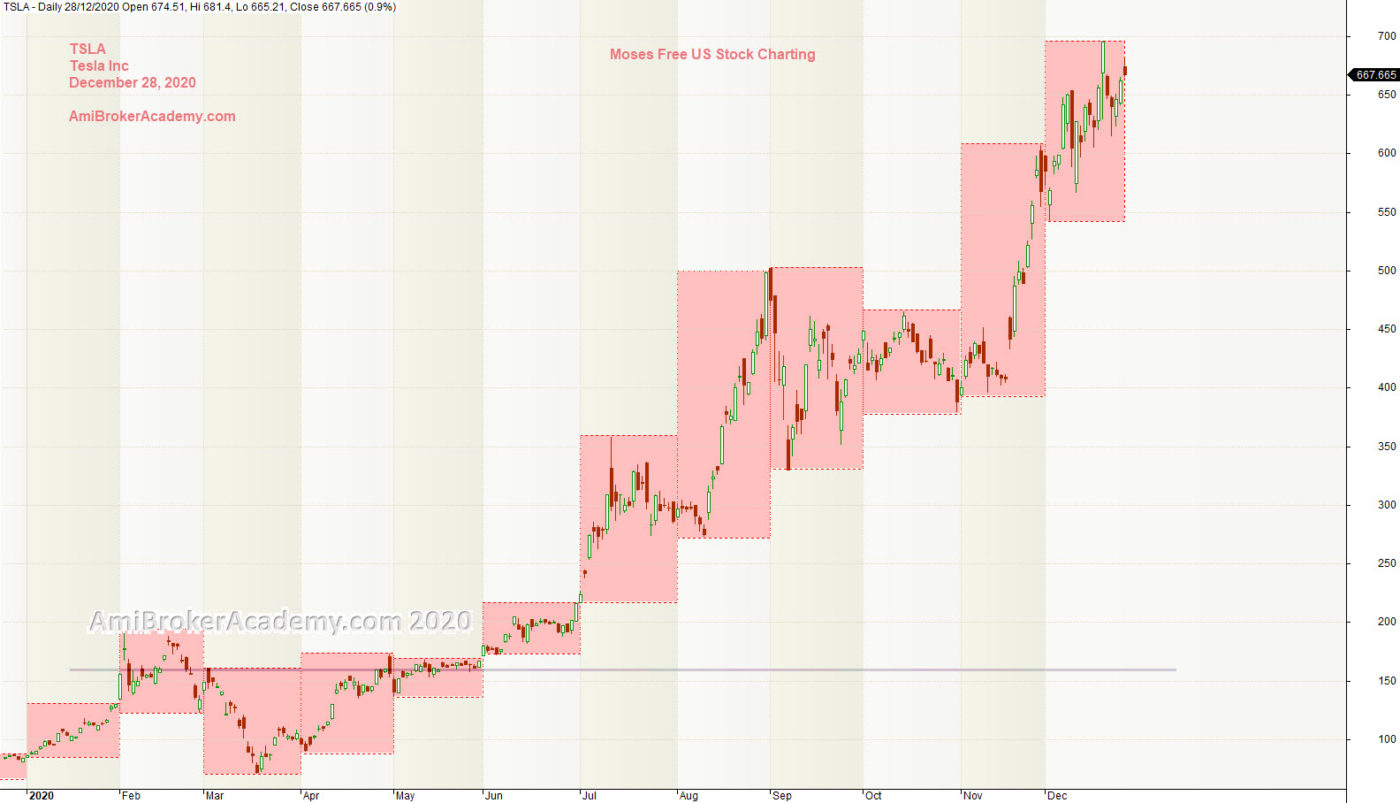
TSLA | Tesla Inc Stock Charting for Last Twelve Months
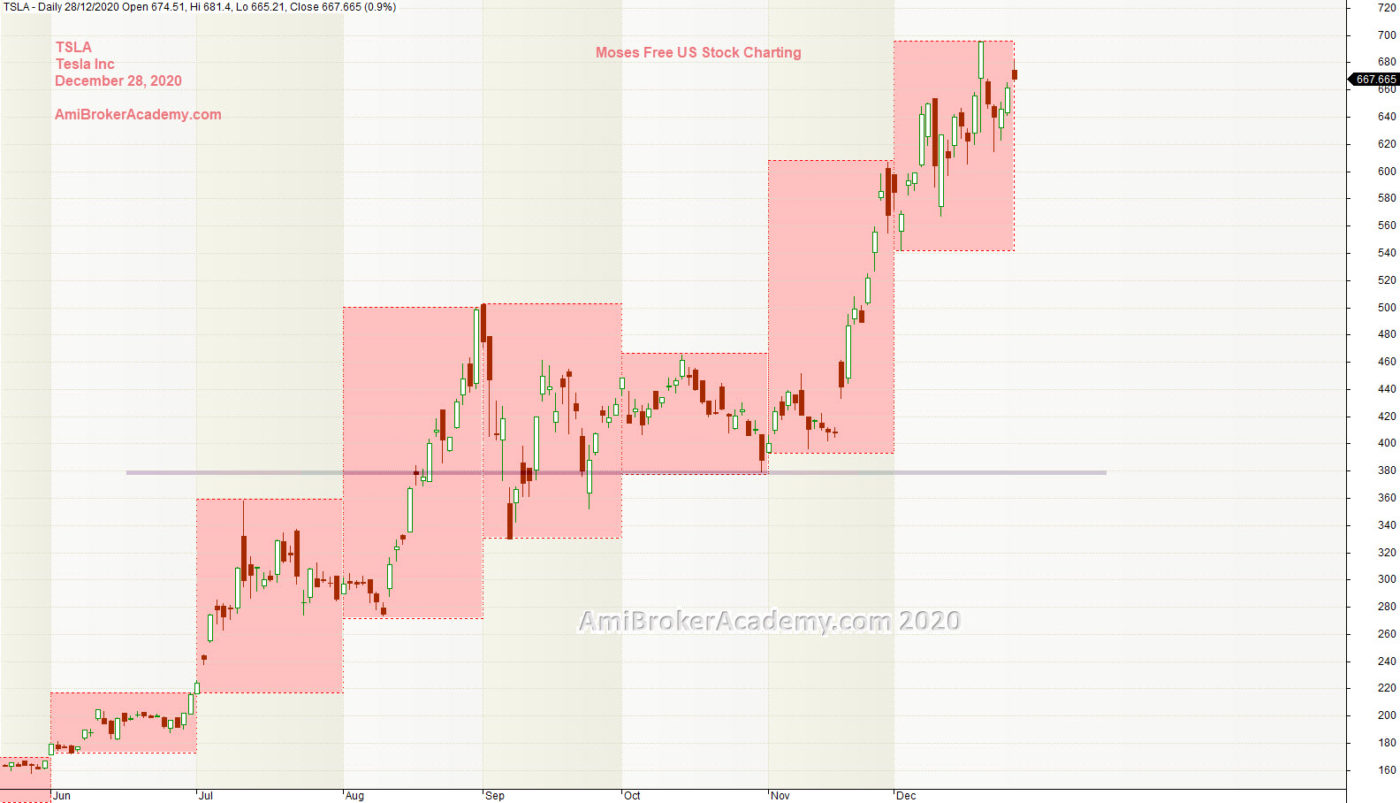
TSLA | Tesla Inc Stock Chart for the last Sim Months
Moses Free Stock Charting
Official AmiBrokerAcademy.com Charting
Disclaimer
We do not recommend buy or sell of any financial instrument. All information post here is to show the power of Amibroker charting software and technical analysis (TA). If you do not know what is TA, please find a training to go through.