26 October 2016
Just Do it! Look Left and Think Right!
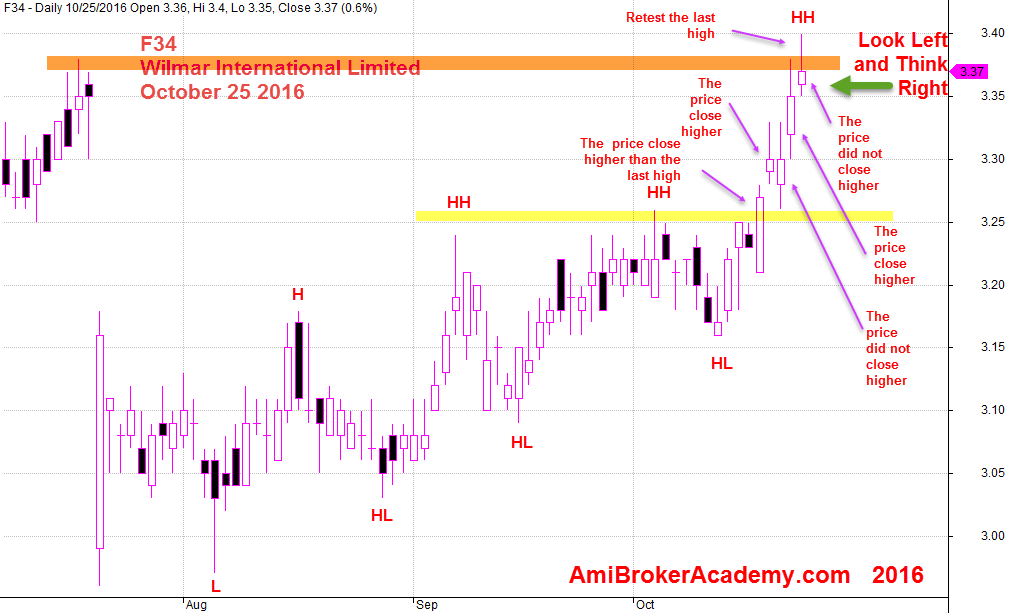
Let’s analyse a chart together, use F34 Wilmar International Limited Daily as an example. Start on the last bar on the right, in other words, we look left and think right. What can you conclude after reading the chart from left to right? Buy or sell. Will, you should see the price is bullish, the stock price keeps forming higher high and higher low. The last bar retest the last high, but close below the last peak. Bullish yet weak lah (Singlish, Singapore English)!
Buy, sure you can. There is no right or wrong. As long as you see there is an opportunity to buy high and sell higher, why not! The market needs the trader that has the sentiment of the stock in believing the price can go higher and there is a momentum.
How was it? It is fun right? Not too difficult. The only request is just do it.
Remember, you can. Forget about the training wheels lah! See the earlier posting on Training Wheels.
F34 Wilmar International Limited Daily
October 25, 2016 Wilmar International Limited Daily
F34 Wilmar International Limited Daily and 34 EMA Wave
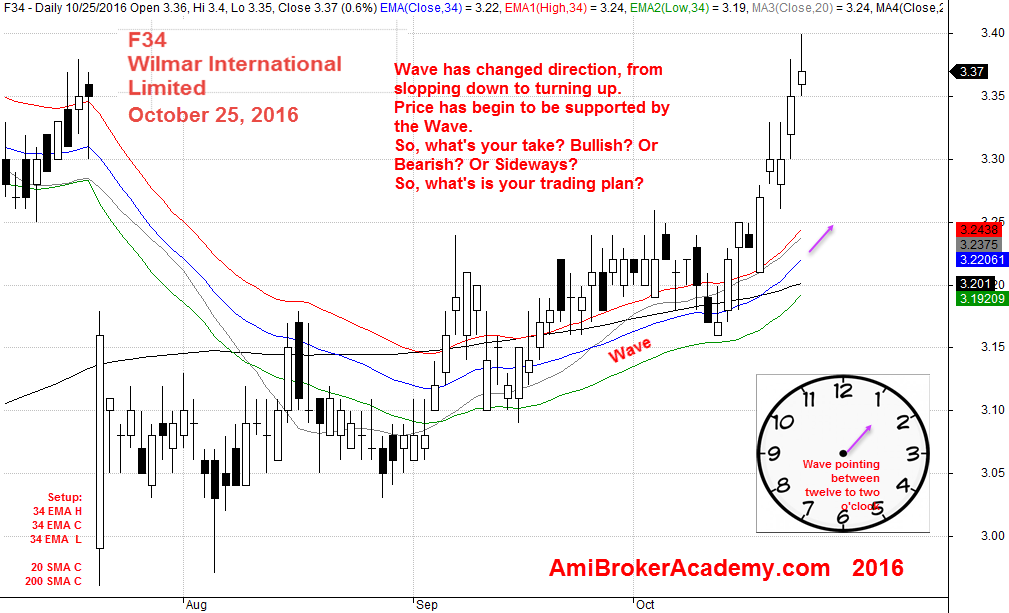
What you see from the chart so far? This is what I see, Wave has changed direction, from slopping down to turning up. Price has begin to be supported by the Wave.
What’s Your Take?
So, what’s your take? Bullish? Or Bearish? Or Sideways?
What’s Your Trading Plan?
So, what’s is your trading plan?
25 October 2016 Wilmar International Limited Daily and 34 EMA Wave
F34 Wilmar International Limited Daily and 21 EMA Wave
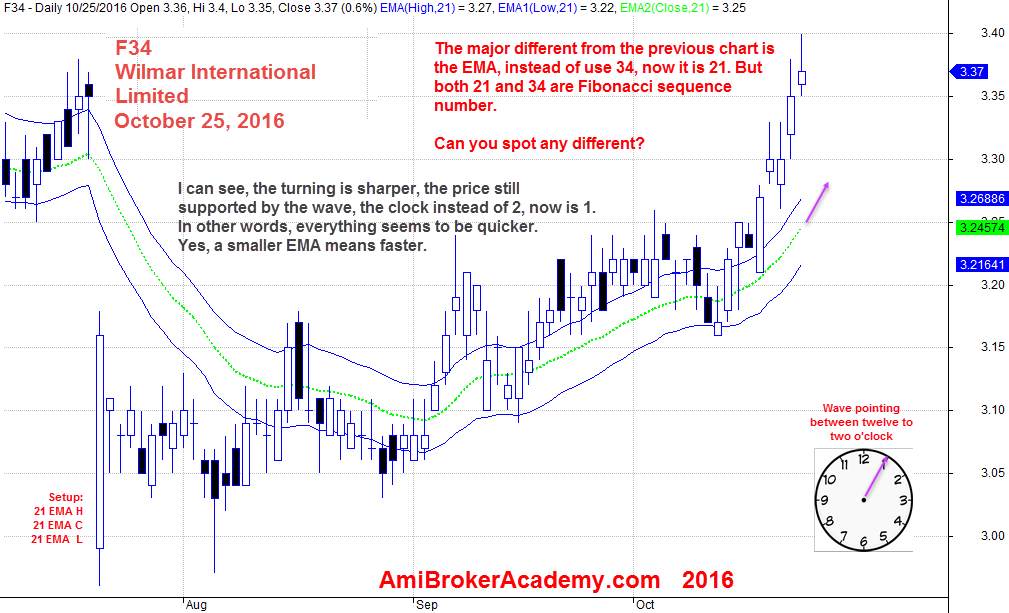
Can you tell the different when using a different set of EMA for wave?
Wave has changed direction, from slopping down to turning up. Price has begin to be supported by the Wave. This remain the same, except all seems to happen faster from the visual point of view.
In fact, we like to say smaller ema is fast, the bigger ema is slow.
So, you should see everything faster, or earlier in charting.
Have fun!
25 October 2016, Wilmar International Limited Daily and 21 EMA Wave
You don’t find site doing analysis like here. Have fun!
Moses Singapore Stock Desk
AmiBrokerAcademy.com
Disclaimer:
The discussion here is for educational purposes only. All information, data, symbols and trading ideas discussed by the author or authors are for demonstration or illustration purposes only and are not recommendations. It is not to be construed or intended as providing trading or legal advice.
This discussion is not an offer or solicitation of any kind in any jurisdiction where any AmiBrokerAcademy.com or its affiliate is try to do business.
Please note that active trading is not suitable for everyone. Decisions you make about your trading or investment are important to you and your family, therefore should be made in consultation with a competent financial advisor or professional. We are not financial advisor and do not claim to be.
Any views expressed here-in are not necessarily those held by amibrokeracademy.com.
We do not represent the external reference, or reference. We can not be responsible for their views and site availability.