November 30, 2018
Thanks for visiting the site.
Shanghai Stock Analysis
600016.SS 中国民生银行 China Minsheng Banking Corp Stock Charting
This stock listed both in Shanghai Stock Exchange and Hong Stock Exchange. Check it out yourself, https://en.wikipedia.org/wiki/China_Minsheng_Bank.
We study 中国民生银行 China Minsheng Banking Corp stock.
Trade with your eyes open. Manage your trade.
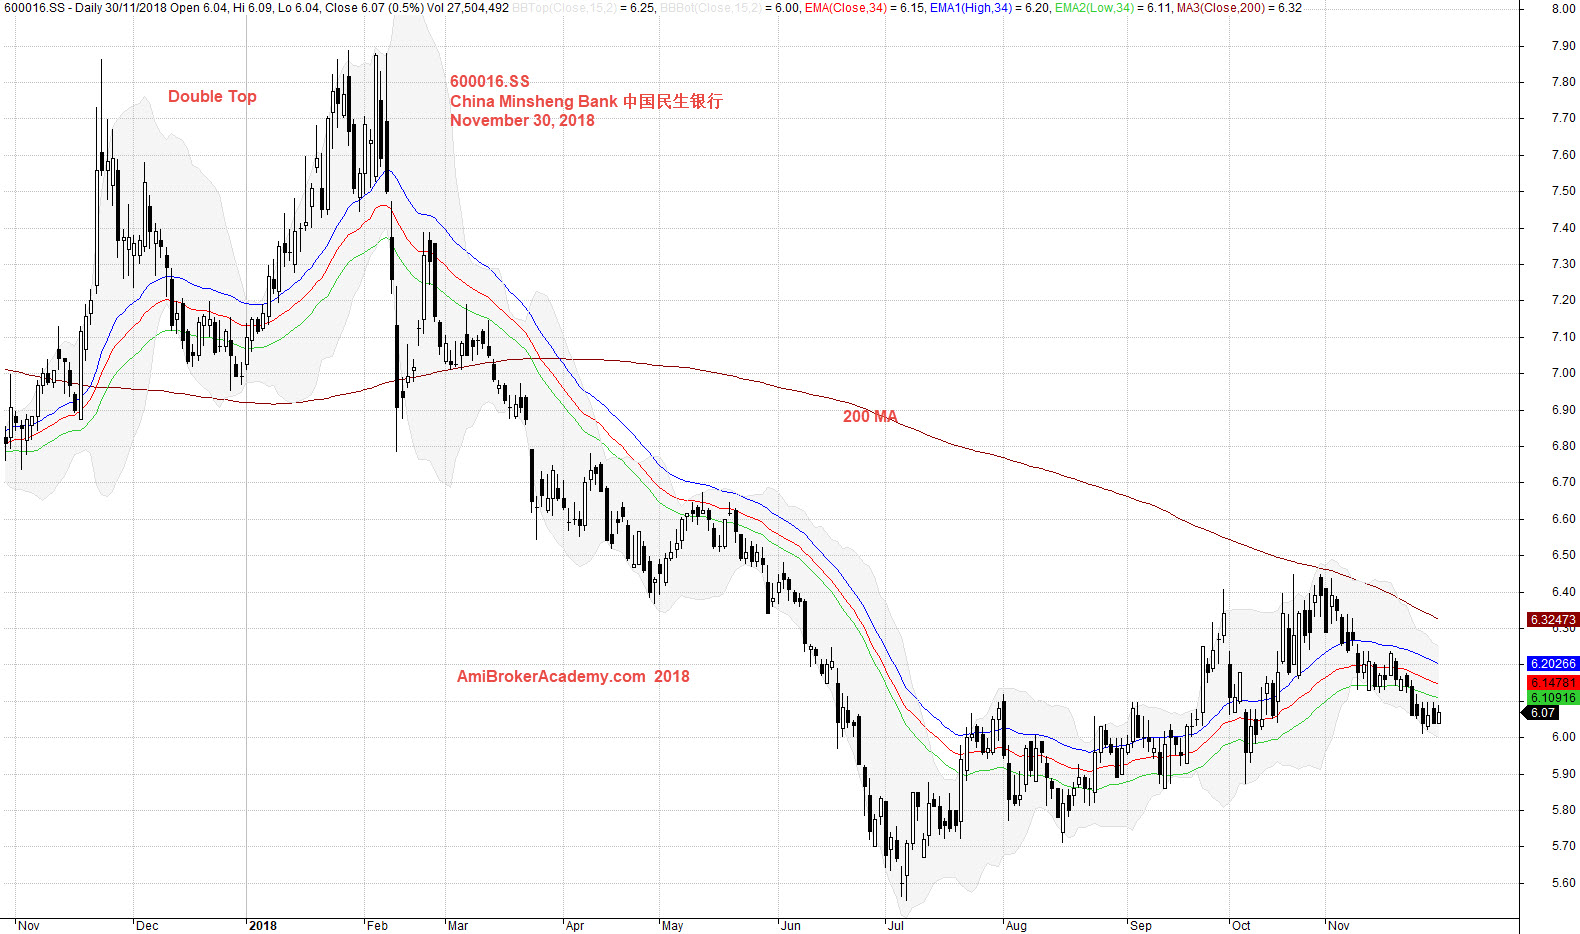
Support Resistance is the an important tool in technical analysis. One application on support resistance is to buy support and sell resistance. When you able to do that I mean buy support and sell resistance. You are likely to buy low and sell high. Many traders are able to use the same concept on moving averages, in other words, instead of using horizontal line. Some trader use moving average or trendline. So, trader look out for moving average act like resistance, or ma act like support. To make it more clear, trader look out for slopping down ma to sell and slopping up ma to buy. See chart, we use three ma, high low and close 34 period ma, we call them river.
Some may ask why 34 MA and not others. Some may ask why MA and not EMA. Or some may ask why use high, low and close. To answer all these question, you could just google (search) and you should got most of the answer. To some may have trouble in googling these, we offer you here what we have found from internet about the 34 period, high, low and close moving average story. Just for your reference only.
Some History
Raghee Horner and 34 EMA Wave
You can use either moving average (MA) or exponential moving average (EMA). The high, low and close 34 EMA, sometime there called it 34 EMA Wave. Raghee Horner was publicly sharing this at ForexFactory.com back in 1997 when she started trading e-mini S&P futures.
See chart, trade with your eyes open.
November 30, 2018 Shanghai Stock 中国民生银行 China Minsheng Banking Corp and River
Zoom out, and study the chart with 200 moving average. See chart. 200 MA slopping down or decline. So, price action goes from high to lower high to lower lower high. Trade with eyes open.
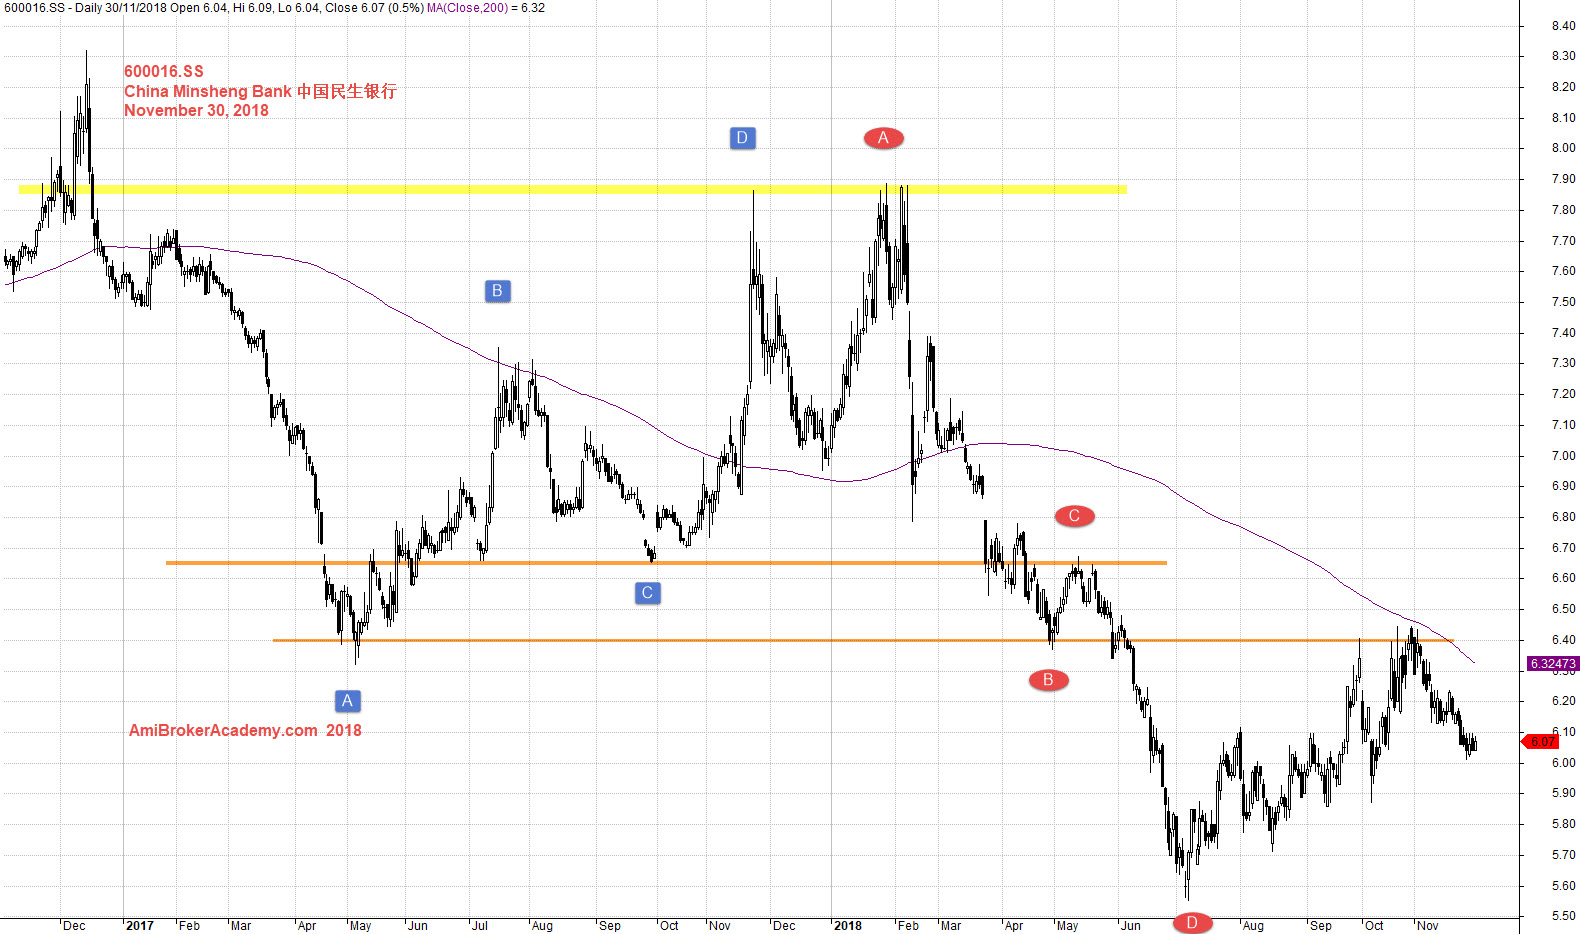
November 30, 2018 Shanghai Stock 中国民生银行 China Minsheng Banking Corp and 200 MA
Zoom in again, using MACD indicator, see chart.
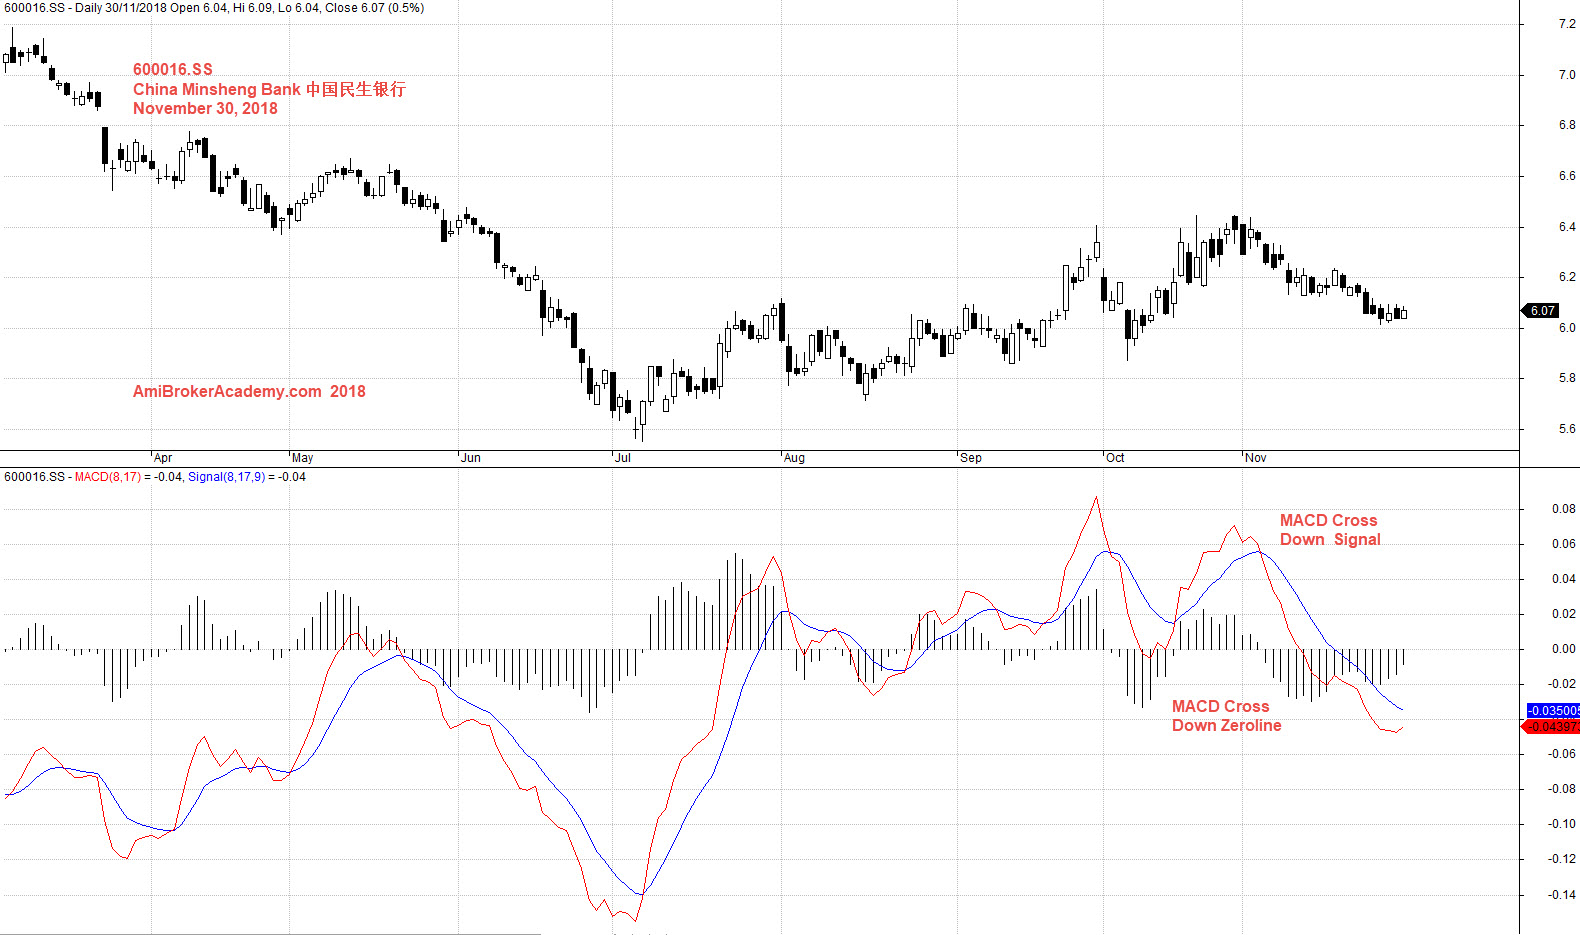
November 30, 2018 Shanghai Stock 中国民生银行 China Minsheng Banking Corp and MACD
Moses
AmiBrokerAcademy.com
Disclaimer
The above result is for illustration purpose. It is not meant to be used for buy or sell decision. We do not recommend any particular stocks. If particular stocks of such are mentioned, they are meant as demonstration of Amibroker as a powerful charting software and MACD. Amibroker can program to scan the stocks for buy and sell signals.
These are script generated signals. Not all scan results are shown here. The MACD signal should use with price action. Users must understand what MACD and price action are all about before using them. If necessary you should attend a course to learn more on Technical Analysis (TA) and Moving Average Convergence Divergence, MACD.
Once again, the website does not guarantee any results or investment return based on the information and instruction you have read here. It should be used as learning aids only and if you decide to trade real money, all trading decision should be your own.