Welcome, welcome to AmiBrokerAcademy.com.
AmiBrokerAcademy.com using AmiBroker powerful charting software to analysis stock chart.
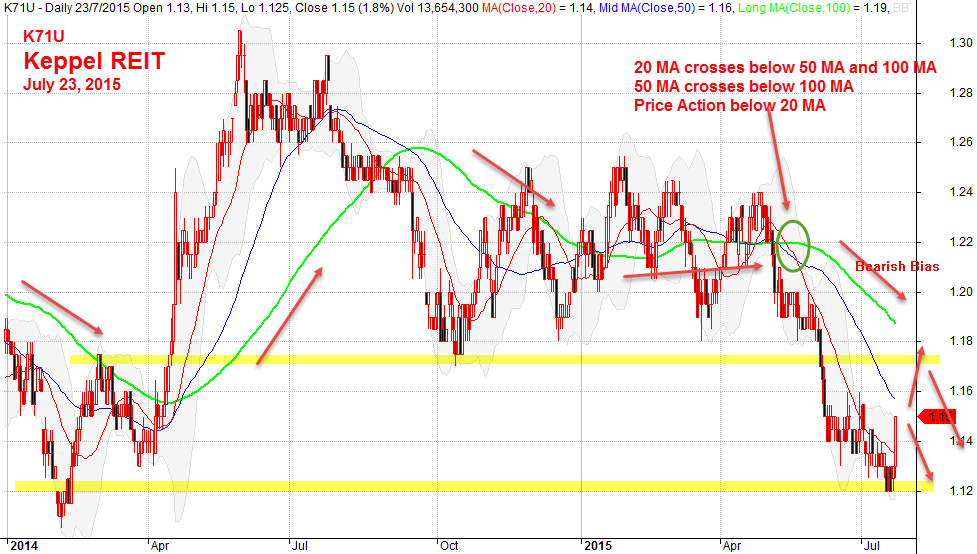
Keppel REIT and Moving Average Analysis
Look at the slow MA; such as 100 MA to identify the trend. Chart worth a thousand words, the trend has gone from down trend to sideway to down trend again in 2015.
Generally, you do not buy when the price action is below the fast ma, such as 20 MA. But you can still buy if you see the trend is in the reversal mode. How? Easy and yet not easy, first when you spot the price action is near a support, especially a significant support. You can enter a buy when the price action completed a bullish chart pattern. There is a possibility the the trend might be reversal.
To increase the probability, if you get the aid from momentum indicator such as MACD, Moving Average Convergence and Divergence. When you spot the price is forming a lower low, but the MACD is forming a higher high. This implies the strength of the stock has increase. However, wait for confirmation.
Confirmation is show hand, wait for the price action has confirm the change in direction. For example, break out from a trendline.
Have fun!
July 23, 2015 Keppel REIT
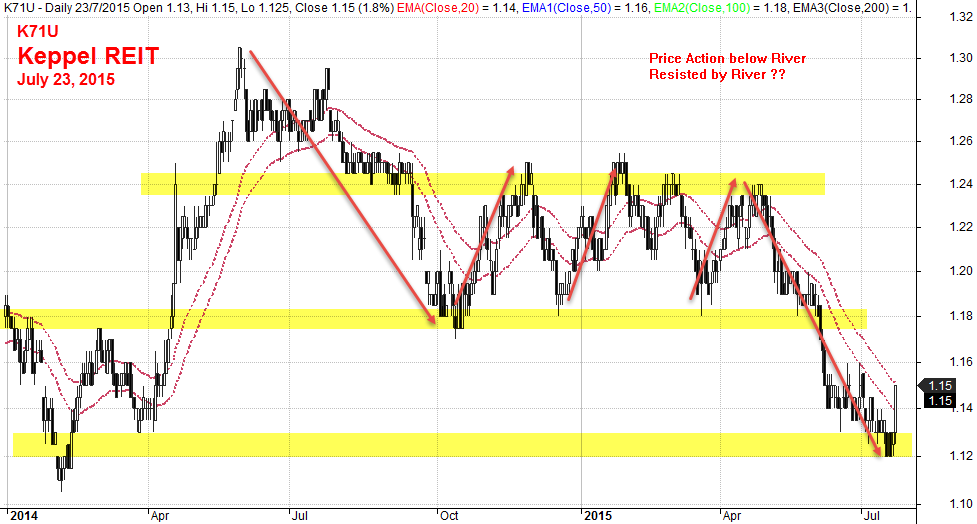
Keppel REIT and River
River is a luxury visual aid to sport uptrend or downtrend. When the price action continue to bounced off and on top of River, it is uptrend. When the price action continue to bounce off and below the River, it is down trend. However, when the Price action keep crossing up and down the River, it is sideway. The trend is neither up or down.
Gartley 222 reversal strategy is either happen near the top or bottom. After the trend keeps moving in one direction, and the volume start decreasing and follow the price action start to do retracement. You can start to monitor the price action. After a short retracement, and the price action bounce backup but lack of strength and start to fail again. You can catch this reversal.
You could spot this in the double top or bottom or head and shoulders chart pattern.
Have fun!
July 23, 2015 Keppel REIT
Thanks for visiting the website.
Moses
DISCLAIMER
Site advice, “Stock trading is not a get rich quick scheme and it is high risk”.
Information provided here is of the nature of a general comment only and no intend to be specific for trading advice. It has prepared without regard to any particular investment objectives, financial situation or needs. Information should NOT be considered as an offer or enticement to buy, sell or trade.
You should seek advice from your broker, or licensed investment advisor, before taking any action.
The website does not guarantee any results or investment return based on the information and instruction you have read here. It should be used as learning aids.