June 8, 2018
Thank you for visiting the site. Hope you like the content.
AAPL Apple Inc and MACD Cross Up Signal
Picture worth a thousand words, see chart MACD Cross Up Signal.
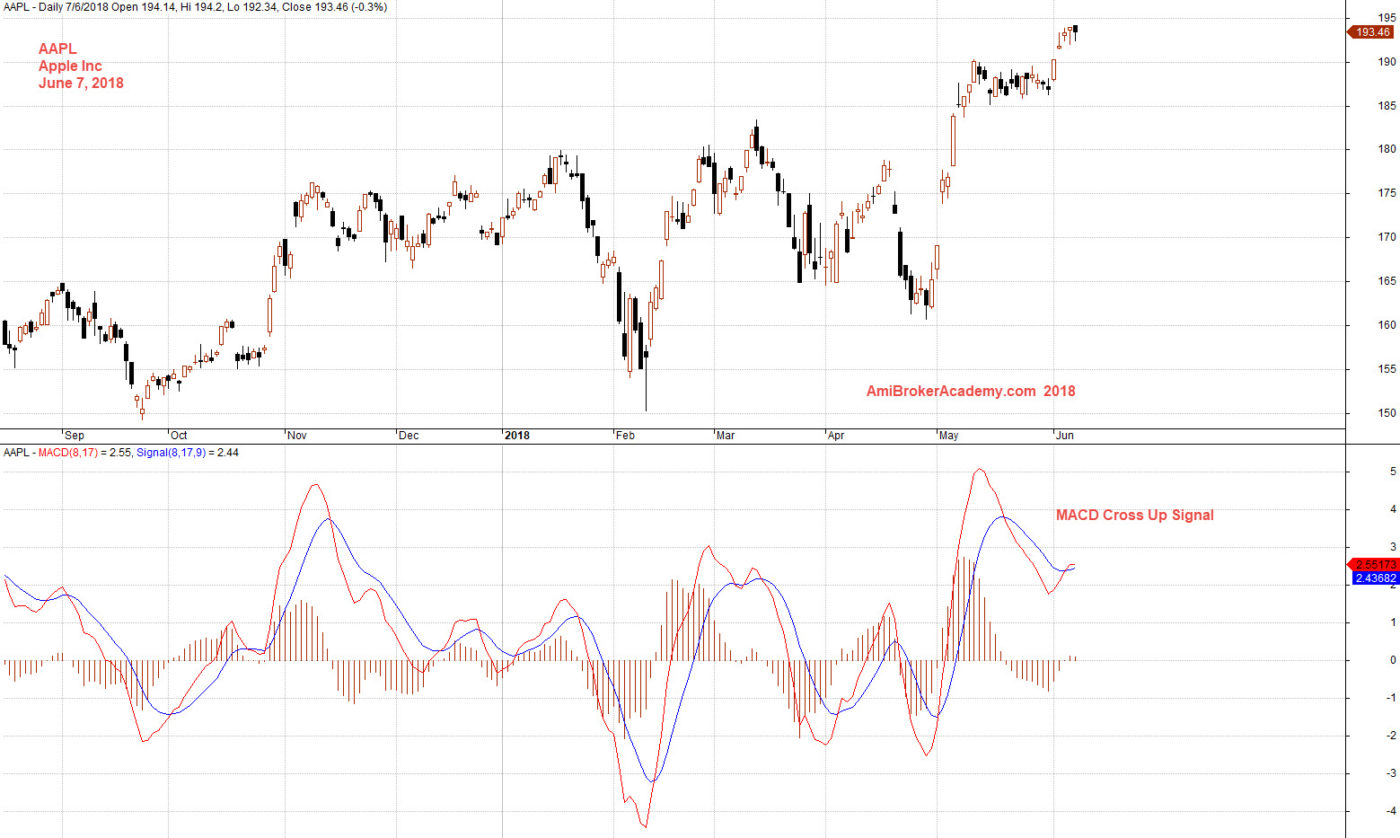
June 7, 2018 Apple Inc and MACD Cross Up Signal
Free MACD Scan One-day US Stock MACD Screening Results on June 6 2018
Remember all setup can fail. This is true for all indicators. It is also true for MACD signals setup.
But, even the setup can fail. Without the MACD scan results, how to find a stock might moves in the near eight thousand stocks market. The MACD signals at least reduce the among the stocks you need to study and make your trade plan.
Manage your risk.
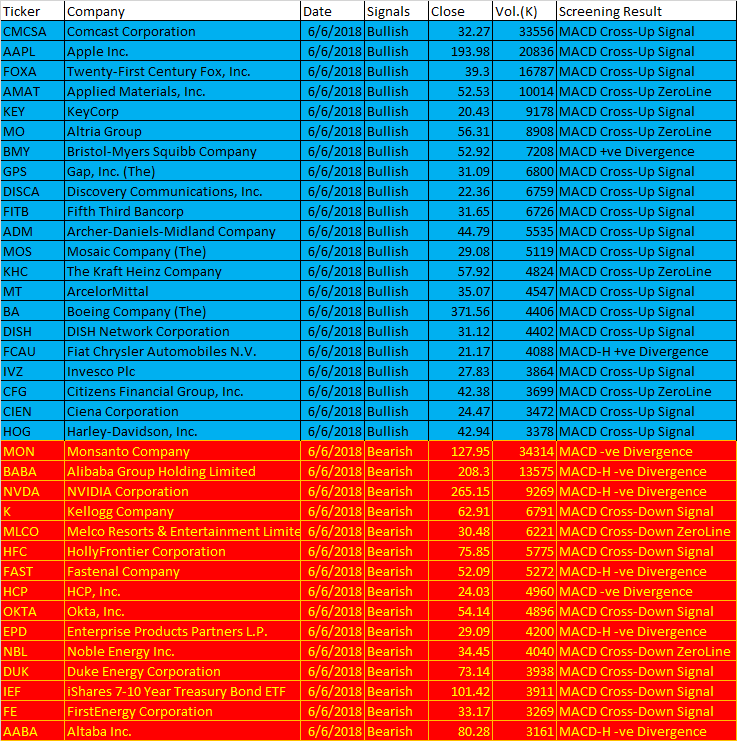
June 6, 2018 US Stock one-day MACD Signals
These are the six types of MACD Signals:
- MACD line crosses above MACD signal – Bullish trend
- MACD line crosses above zero line – Bullish trend
- MACD Histogram +ve Divergence – Bullish trend
- MACD line crosses below MACD signal – Bearish trend
- MACD line crosses below zero line – Bearish trend
- MACD Histogram -ve Divergence – Bearish trend
| Ticker | Company | Date | Signals | Close | Vol.(K) | Screening Result |
| CMCSA | Comcast Corporation | 6/6/2018 | Bullish | 32.27 | 33556 | MACD Cross-Up Signal |
| AAPL | Apple Inc. | 6/6/2018 | Bullish | 193.98 | 20836 | MACD Cross-Up Signal |
| FOXA | Twenty-First Century Fox, Inc. | 6/6/2018 | Bullish | 39.3 | 16787 | MACD Cross-Up Signal |
| AMAT | Applied Materials, Inc. | 6/6/2018 | Bullish | 52.53 | 10014 | MACD Cross-Up ZeroLine |
| KEY | KeyCorp | 6/6/2018 | Bullish | 20.43 | 9178 | MACD Cross-Up Signal |
| MO | Altria Group | 6/6/2018 | Bullish | 56.31 | 8908 | MACD Cross-Up ZeroLine |
| BMY | Bristol-Myers Squibb Company | 6/6/2018 | Bullish | 52.92 | 7208 | MACD +ve Divergence |
| GPS | Gap, Inc. (The) | 6/6/2018 | Bullish | 31.09 | 6800 | MACD Cross-Up Signal |
| DISCA | Discovery Communications, Inc. | 6/6/2018 | Bullish | 22.36 | 6759 | MACD Cross-Up Signal |
| FITB | Fifth Third Bancorp | 6/6/2018 | Bullish | 31.65 | 6726 | MACD Cross-Up Signal |
| ADM | Archer-Daniels-Midland Company | 6/6/2018 | Bullish | 44.79 | 5535 | MACD Cross-Up Signal |
| MOS | Mosaic Company (The) | 6/6/2018 | Bullish | 29.08 | 5119 | MACD Cross-Up Signal |
| KHC | The Kraft Heinz Company | 6/6/2018 | Bullish | 57.92 | 4824 | MACD Cross-Up ZeroLine |
| MT | ArcelorMittal | 6/6/2018 | Bullish | 35.07 | 4547 | MACD Cross-Up Signal |
| BA | Boeing Company (The) | 6/6/2018 | Bullish | 371.56 | 4406 | MACD Cross-Up Signal |
| DISH | DISH Network Corporation | 6/6/2018 | Bullish | 31.12 | 4402 | MACD Cross-Up Signal |
| FCAU | Fiat Chrysler Automobiles N.V. | 6/6/2018 | Bullish | 21.17 | 4088 | MACD-H +ve Divergence |
| IVZ | Invesco Plc | 6/6/2018 | Bullish | 27.83 | 3864 | MACD Cross-Up Signal |
| CFG | Citizens Financial Group, Inc. | 6/6/2018 | Bullish | 42.38 | 3699 | MACD Cross-Up ZeroLine |
| CIEN | Ciena Corporation | 6/6/2018 | Bullish | 24.47 | 3472 | MACD Cross-Up Signal |
| HOG | Harley-Davidson, Inc. | 6/6/2018 | Bullish | 42.94 | 3378 | MACD Cross-Up Signal |
| MON | Monsanto Company | 6/6/2018 | Bearish | 127.95 | 34314 | MACD -ve Divergence |
| BABA | Alibaba Group Holding Limited | 6/6/2018 | Bearish | 208.3 | 13575 | MACD-H -ve Divergence |
| NVDA | NVIDIA Corporation | 6/6/2018 | Bearish | 265.15 | 9269 | MACD-H -ve Divergence |
| K | Kellogg Company | 6/6/2018 | Bearish | 62.91 | 6791 | MACD Cross-Down Signal |
| MLCO | Melco Resorts & Entertainment Limited | 6/6/2018 | Bearish | 30.48 | 6221 | MACD Cross-Down ZeroLine |
| HFC | HollyFrontier Corporation | 6/6/2018 | Bearish | 75.85 | 5775 | MACD Cross-Down Signal |
| FAST | Fastenal Company | 6/6/2018 | Bearish | 52.09 | 5272 | MACD-H -ve Divergence |
| HCP | HCP, Inc. | 6/6/2018 | Bearish | 24.03 | 4960 | MACD -ve Divergence |
| OKTA | Okta, Inc. | 6/6/2018 | Bearish | 54.14 | 4896 | MACD Cross-Down Signal |
| EPD | Enterprise Products Partners L.P. | 6/6/2018 | Bearish | 29.09 | 4200 | MACD-H -ve Divergence |
| NBL | Noble Energy Inc. | 6/6/2018 | Bearish | 34.45 | 4040 | MACD Cross-Down ZeroLine |
| DUK | Duke Energy Corporation | 6/6/2018 | Bearish | 73.14 | 3938 | MACD Cross-Down Signal |
| IEF | iShares 7-10 Year Treasury Bond ETF | 6/6/2018 | Bearish | 101.42 | 3911 | MACD Cross-Down Signal |
| FE | FirstEnergy Corporation | 6/6/2018 | Bearish | 33.17 | 3269 | MACD Cross-Down Signal |
| AABA | Altaba Inc. | 6/6/2018 | Bearish | 80.28 | 3161 | MACD-H -ve Divergence |
Moses US Stock ScanYou must understand what MACD is all about before using the results.
AmiBroker Academy.com
Disclaimer:
The above result is for illustration purpose. It is not meant to be used for buy or sell decision. We do not recommend any particular stocks. If particular stocks of such are mentioned, they are meant as demonstration of Amibroker as a powerful charting software and MACD. Amibroker can program to scan the stocks for buy and sell signals.
These are script generated signals. Not all scan results are shown here. The MACD signal should use with price action. Users must understand what MACD and price action are all about before using them. If necessary you should attend a course to learn more on Technical Analysis (TA) and Moving Average Convergence Divergence, MACD.
Once again, the website does not guarantee any results or investment return based on the information and instruction you have read here. It should be used as learning aids only and if you decide to trade real money, all trading decision should be your own.