Welcome to AmiBrokerAcademy.com.
Jardine Matheson Holdings Ltd J36
This is a weekly data. Double top, price just cross the neckline. Price action may pull back and get resisted by neckline. Will see.
Chart worth a thousand words.
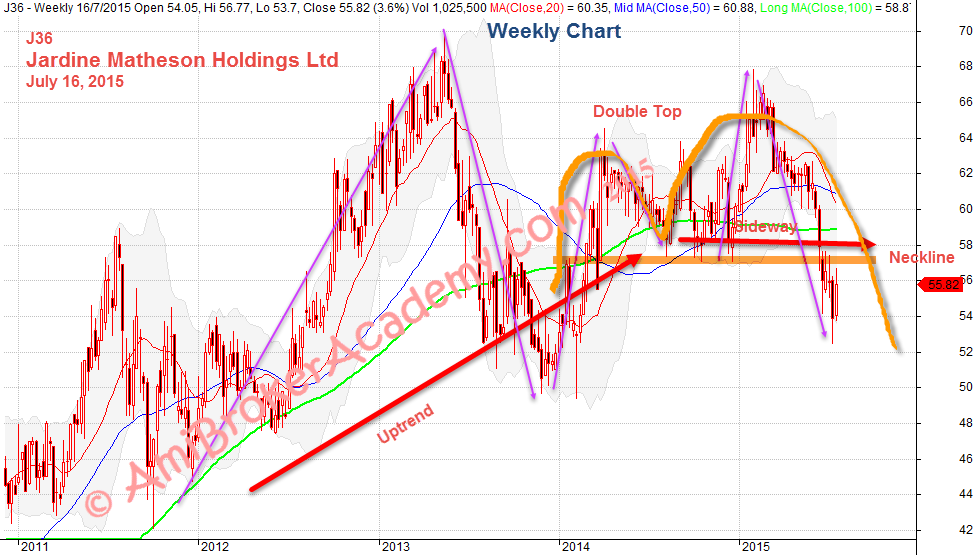
July 16, 2015 Jardine Matheson Holdings Weekly Chart Four Plus Years Data
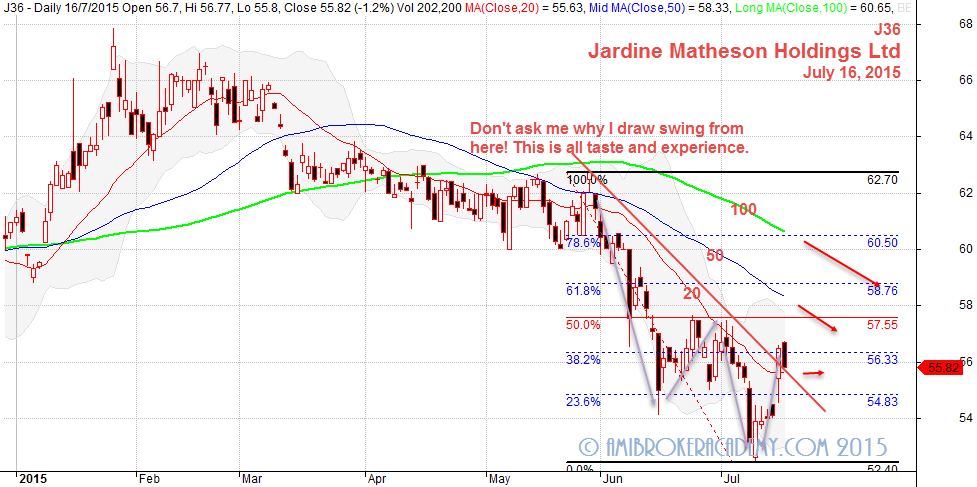
Jardine Matheson Holdings – Daily Chart
Zoom in and see the chart closely. The moving averages are wide open. 50 MA and 100 MA are pointing down; the trend is still very bearish. Can the retracement pull back even higher? Will see.
Moving Average is a great visual tool.
July 16, 2015 Jardine Matheson Holdings
You can read about other Singapore Stocks daily and weekly and daily scan results in this website.
Thanks for visiting the website.
Moses
DISCLAIMER
Site advice, “Stock trading is not a get rich quick scheme and it is high risk”.
Information provided here is of the nature of a general comment only and no intend to be specific for trading advice. It has prepared without regard to any particular investment objectives, financial situation or needs. Information should NOT be considered as an offer or enticement to buy, sell or trade.
You should seek advice from your broker, or licensed investment advisor, before taking any action.
The website does not guarantee any results or investment return based on the information and instruction you have read here. It should be used as learning aids.