December 11, 2016
Moses US Stock Analysis
Support and Resistance
S & R is the basic tool for technical analysis. But, not every trader draws the same support and resistance. In trading there is no right no wrong, price action can react to any level. Every trade has their reason on deciding which is the S&R. Some uses the day, some uses the week, some uses the month. What you are going to experience here is the support and resistance base on year, year of every twelve calender months and not every twelve month. Have fun!
INTC | Intel Corporation Stock Analysis and ABCD Chart Pattern
The following chart, you see 2016 is making higher high compare to 2015. From ABCD chart pattern, if the setup do not fail, 2017 will be higher than 2016. Keep watching.
Just to not ABCD is an easy tool to determine the next level. Again, have fun!
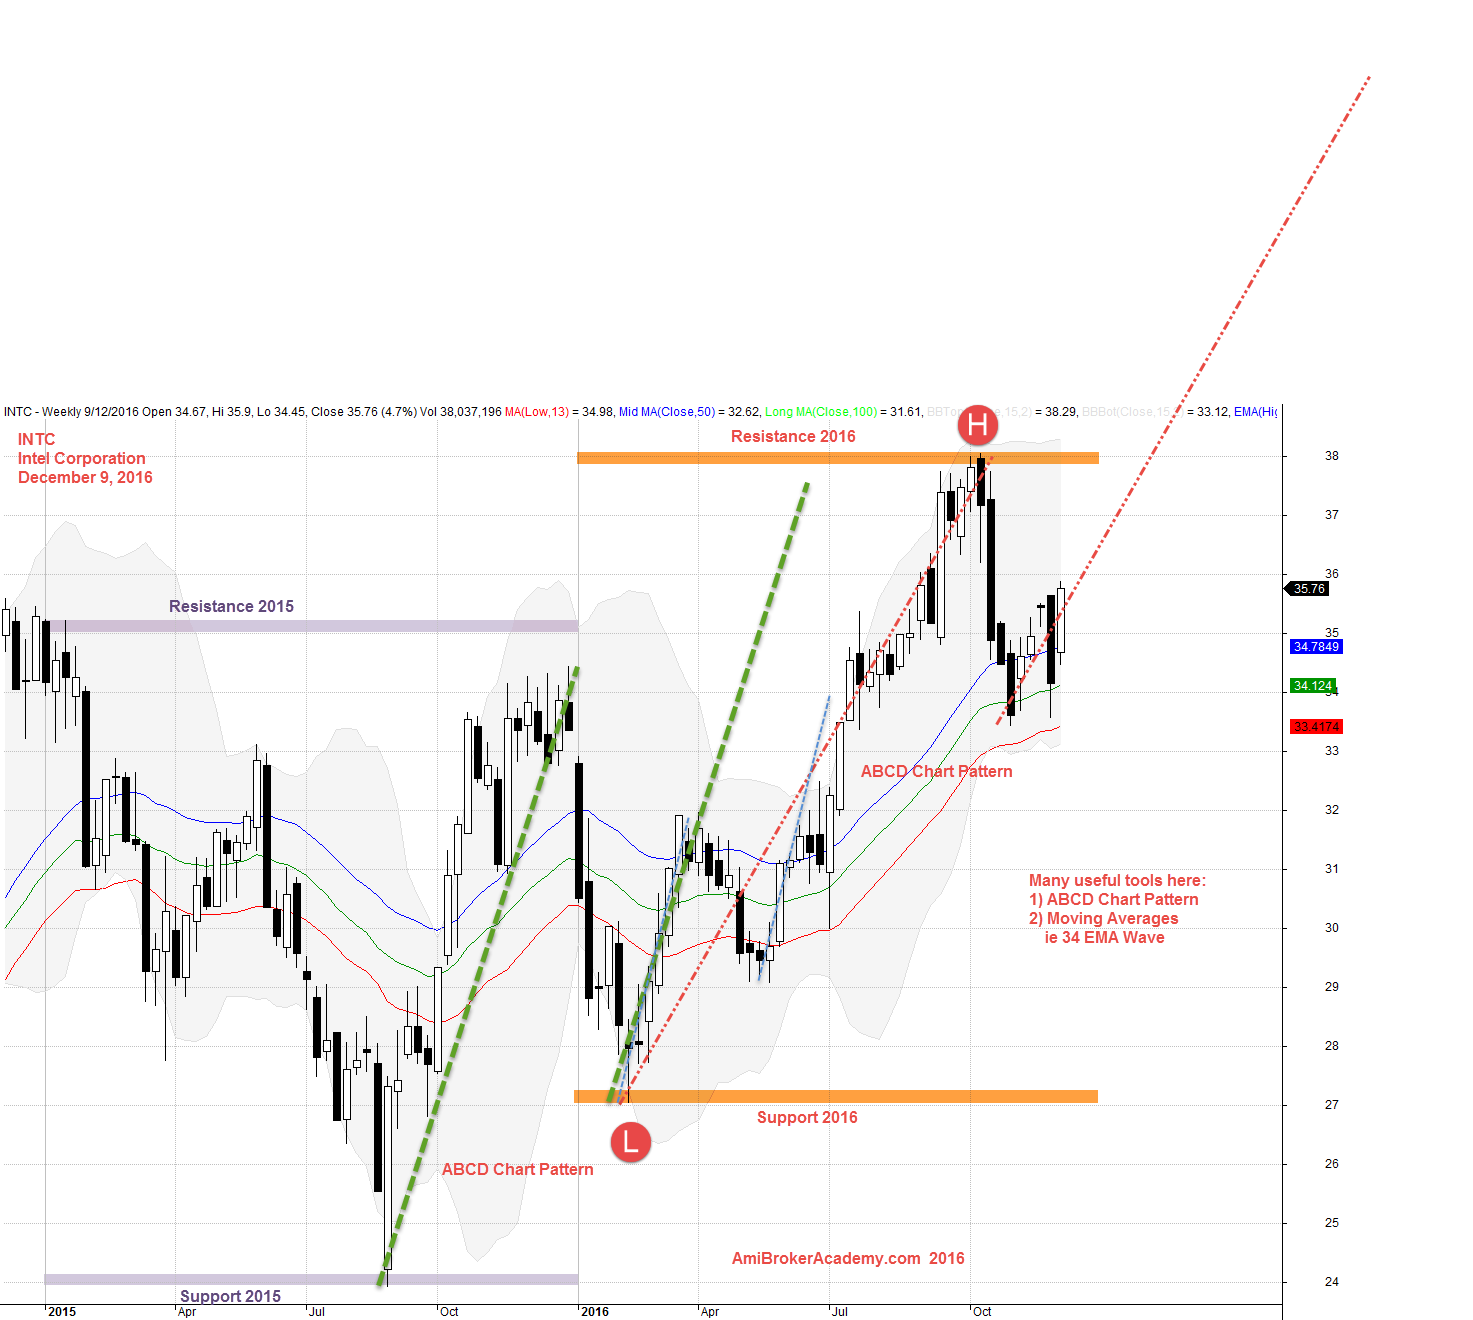
December 9, 2016 Intel Corporation Weekly
Moses Free Stock Analysis
AmiBrokerAcademy.com
Disclaimer:
The discussion here is for educational purposes only. All information, data, symbols and trading ideas discussed hereby are the author or authors intend to demonstrate or illustrate purposes only. These are not recommendations or advice. It is not to be construed or intended as providing trading or legal advice.
Besides that this discussion is not an offer or solicitation of any kind in any jurisdiction where any AmiBrokerAcademy.com or its affiliate is try to do business.
Please note that active trading is not suitable for everyone. Any decisions you make about your trading or investment are important to you and your family, therefore should be made in consultation with a competent financial advisor or professional. We are not financial advisor and do not claim to be one.
Any views expressed here-in are not necessarily those held by amibrokeracademy.com.