Welcome to AmiBrokerAcademy.com.
This website uses powerful charting software AmiBroker for charting and indicators.
Picture Worth a Thousand Words
Many of the answer are already in the additional lines and comments on the chart. See chart for more information. Please google stocks to find other views on this.
Support and Resistance
SR or S&R, Support and Resistance is the most basic tool in chart analysis, or charting. The worst charting software will still have S&R. You will realize that the price action will response to all support and resistance, either the price action change direction or continue. Support and Resistance only need one point, and you draw the horizontal line from that point. The point we refer to the end of a candlestick.
Just to be clear, a point is either at the peak or bottom, at least formed by three candlesticks. If you use line chart, or bar, then three lines or three bars.
Many make a mistake by taking the most recent bar, candlestick or line as a point. This is not yet completed.
Trendline
Trendline is an extension of SR, support and resistance. You connect two points to form a trendline. You will find uptrend line, or downtrend line. It has the same characteristic as Support and Resistance, the price action will react to it. Either breakout or re bounce from the trendline.
Moving Average
Another form of SR, support and resistance is Moving Average, MA. The price action react the MA, by breaking out or re bouncing from MA. It has the same characteristics of Support and Resistance.
In fact, many of the professional traders, trade only using Support and Resistance, trendline, and moving averages.
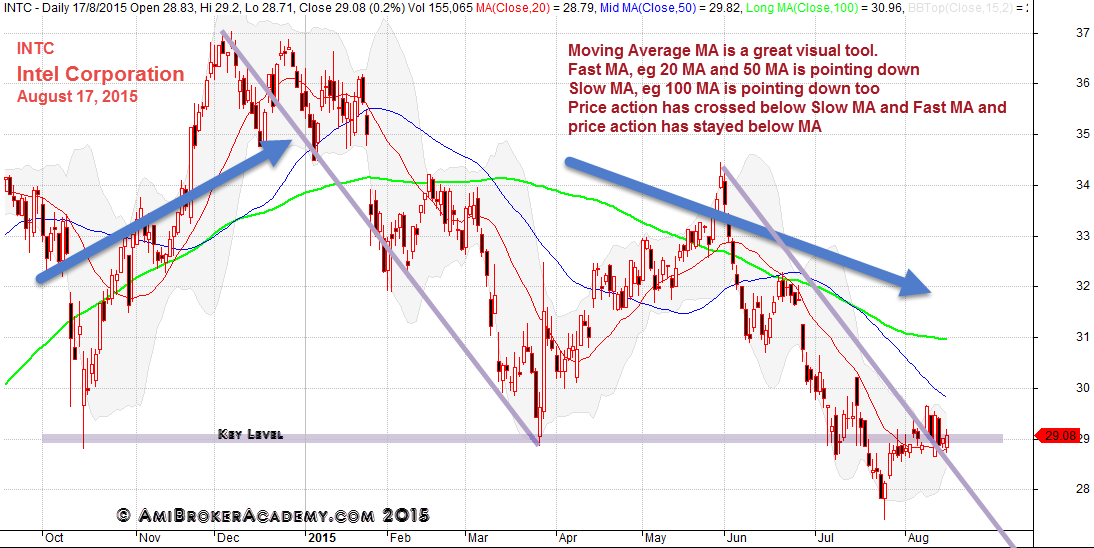
US Intel Corporation Stock Analysis
Where will the stock price go? Downtrend?
Even when it is downtrend, the price action will still pull up. The price will always goes up first before coming further down.
Can you see why it is downtrend?
The green moving average gives you the clue. Gree moving average is 100 MA. It has showed up and then down. 100 MA and more stable, it smooths out the price action. After April 2015, the 100 MA has started to decline. So, watch and be safe.
Have fun!
Note for AB = CD chart pattern too.
Remember All Setup Can Fail!
August 17, 2015 Intel Corporation
Thanks for visiting the website.
Moses
DISCLAIMER
Website advice, “Stock trading is not a get rich quick scheme and it is high risk”.
Information provided here is of the nature of a general comment only and no intend to be specific for trading advice. It has prepared without regard to any particular investment objectives, financial situation or needs. Information should NOT be considered as an offer or enticement to buy, sell or trade.
You should seek advice from your broker, or licensed investment advisor, before taking any action.
The website does not guarantee any results or investment return based on the information and instruction you have read here. It should be used as learning aids.
THE CONTENTS HERE REFLECT THE AUTHOR’S VIEWS ACQUIRED THROUGH HIS EXPERIENCE ON THE TOPIC. THE AUTHOR OR WEBSITE DISCLAIMS ANY LOSS OR LIABILITY CAUSED BY THE UTILIZATION OF ANY INFORMATION PRESENTED HEREIN.
BESIDES THAT THE SOURCES MENTIONED HEREIN ARE ASSUMED TO BE RELIABLE AT THE TIME OF WRITING, THE AUTHOR AND WEBSITE ARE NOT RESPONSIBLE FOR THEIR ACCURACY AND ACTIVITIES.
THE CONTENT ONLY SHOULD BE CONSIDERED SOLELY FOR BASIC INFORMATION.
COPYRIGHT © 2015 Moses @ AmiBrokerAcademy.com. ALL RIGHTS RESERVED.
NO PART OF THE CONTENT MAY BE ALTERED, COPIED, OR DISTRIBUTED, WITHOUT PRIOR WRITTEN PERMISSION OF THE AUTHOR OR SITE.
ALL PRODUCT NAMES, LOGOS, AND TRADEMARKS ARE PROPERTY OF THEIR RESPECTIVE OWNERS WHO HAVE NOT NECESSARILY ENDORSED, SPONSORED, REVIEWED OR APPROVED THIS PUBLICATION.