Welcome to AmiBrokerAcademy.com.
This website here uses powerful charting software AmiBroker for charting and analysis.
HP Hewlett Packard Company Stock Analysis
Picture worth a thousand words. From chart, price action has retest the same high and then break out for a further high. However, the price action after 2015 start to falling. If you use Garley Reversal Strategy you may find clues on why the stock price fail off the top.
Has the stock find a support? Will see.
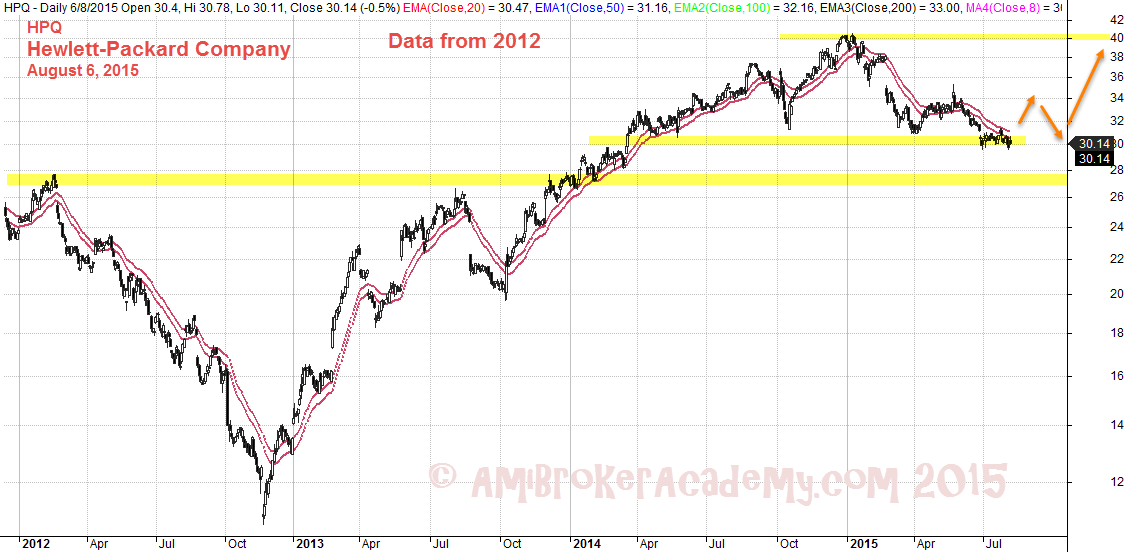
August 6, 2015 Hewlett Packard Company Data Since 2012
Another Scenario HP Stock Analysis
From the chart below, if you overlay Gartley Reversal, you may see there is a probability of further bearish trend.

August 6, 2015 Hewlett Packard Company
Remember all setup can fail. So wait for market to show hand. You can buy or sell depending what the market info.
Thanks for visiting the website.
Moses
DISCLAIMER
Site advice, “Stock trading is not a get rich quick scheme and it is high risk”.
Information provided here is of the nature of a general comment only and no intend to be specific for trading advice. It has prepared without regard to any particular investment objectives, financial situation or needs. Information should NOT be considered as an offer or enticement to buy, sell or trade.
You should seek advice from your broker, or licensed investment advisor, before taking any action.
The website does not guarantee any results or investment return based on the information and instruction you have read here. It should be used as learning aids.