Welcome! Welcome to AmiBrokerAcademy.com.
Google Inc Stock Analysis
Picture worth a thousand words. Price action has been in ranging for two plus months; accumulation, finally exploded. The price action gap up. Is this final? Will see.
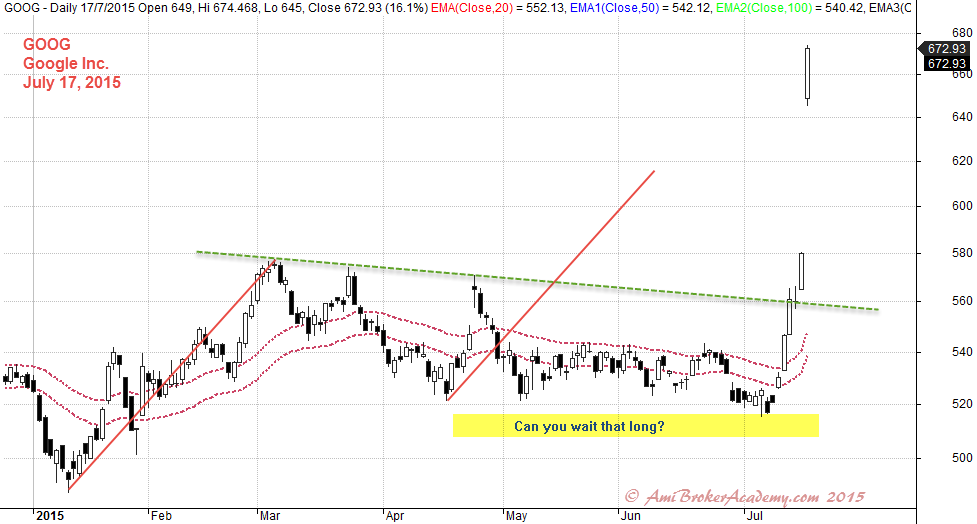
July 17, 2015 Google Inc
Google Inc Stock Analysis with Fibonacci
Wow! From the swing low to swing high, the price action retrace back to 61.8 per cent and get supported. 61.8 per cent get retested a few times, from experience (or many trader) if the level get retested a few times. Watch out, the level must be quit significant. So always be patient, when the price action breakout 61.8 % do not rush in. You will get trap, bear trap.
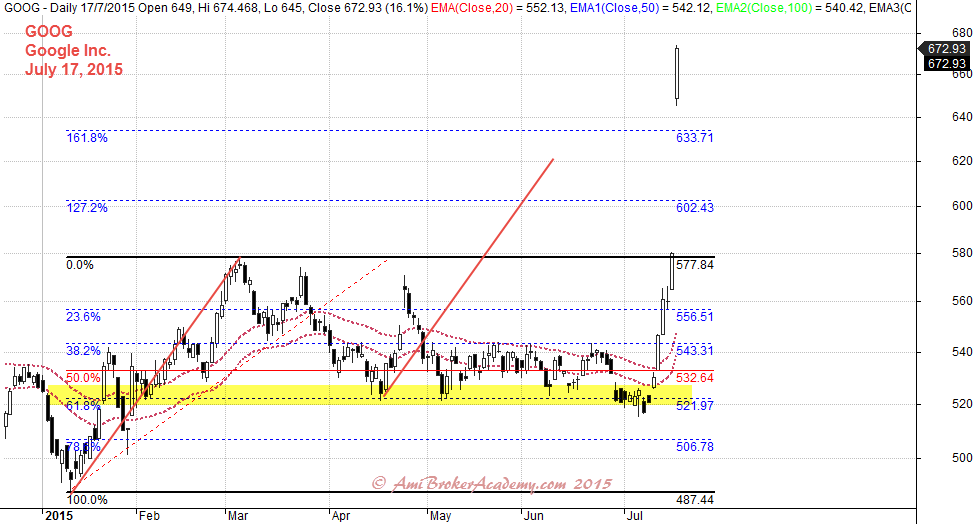
July 17, 2015 Google Inc and Fibonacci
You can google stock to find other stock.
Thanks for visiting the website.
Moses
DISCLAIMER
Site advice, “Stock trading is not a get rich quick scheme and it is high risk”.
Information provided here is of the nature of a general comment only and no intend to be specific for trading advice. It has prepared without regard to any particular investment objectives, financial situation or needs. Information should NOT be considered as an offer or enticement to buy, sell or trade.
You should seek advice from your broker, or licensed investment advisor, before taking any action.
The website does not guarantee any results or investment return based on the information and instruction you have read here. It should be used as learning aids.