Welcome to AmiBroker Academy.com.
General Electric Company GE Stock
Stock price is flying above 50 MA, and trade in range of 20 MA. Price action has crossed up MAs, and bounced above MAs. You can see inverted head and shoulders, bullish flag chart pattern, and may be completing bullish pennant chart pattern. Will see.
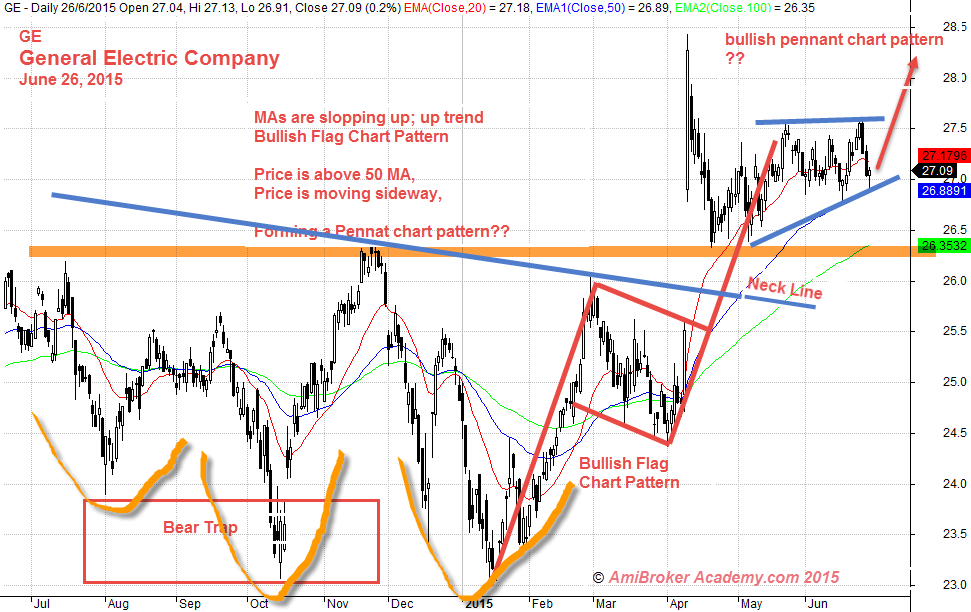
General Electric Company June 26, 2015
You can read about other US Stocks and Singapore Stocks analysis and scan in this website.
Thanks for visiting the website.
Moses
DISCLAIMER
Site advice, “Stock trading is not a get rich quick scheme and it is high risk”.
Information provided here is of the nature of a general comment only and no intend to be specific for trading advice. It has prepared without regard to any particular investment objectives, financial situation or needs. Information should NOT be considered as an offer or enticement to buy, sell or trade.
You should seek advice from your broker, or licensed investment advisor, before taking any action.
The website does not guarantee any results or investment return based on the information and instruction you have read here. It should be used as learning aids.