8 April, 2018
Janet Louise Yellen United States Federal Reserve System Chairman Ever Reminded Us Do Not Forget the Damage from Financial Crisis!
What Can We Learn From Past Financial Crises such as Black Monday on October 19, 1987?
Read our charts on 2018 Finance Crisis and Black Monday.
Black Monday | ^GSPC S&P 500 Index October 1987 Crashed Charting | AmiBrokerAcademy.com
Oscillator Moving Average Convergence Divergence
MACD is a popular trend following momentum indicator that shows the relationship of two moving averages of prices action; the MACD line and signal line.
You could reference to the MACD signals to manage your trade risk.
You Could Find Four MACD Signals:
- Crossovers – Sell Strategy, MACD crosses below the signal line. Buy Strategy, MACD rallies above the signal line. It is advisable to wait for confirmation to reduce possible whipsaw.
- Divergence – The security price action diverges from the MACD. It signals the end of the current trend.
- Cross Zero Line – MACD moves above or below zero line. Upward trend: Cross above zero line, short MA above long MA. Downward trend: Cross below zero line, short MA below long MA.
- Dramatic rise or fall – MACD rises or decline dramatically – when the shorter moving average pulls away from the longer-term moving average – Oversold or Overbought.
Free One-day US Stock MACD Screening Results on April 5 2018
Remember all setup can fail. This is true for all indicators. It is also true for MACD signals setup. See some of the MACD setup fail examples on this website.
The market mode swing, there are more buy signals as compare to the April 2. Manage your risk.
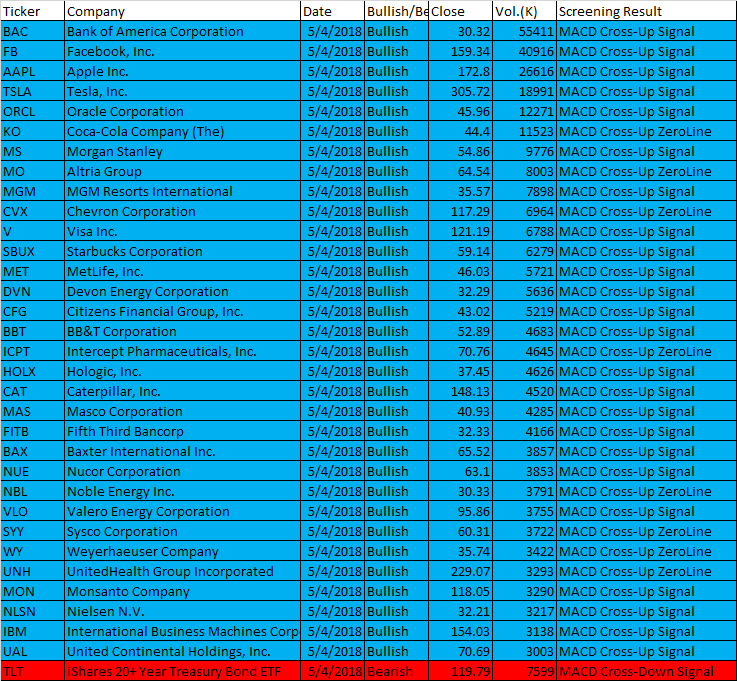
April 5, 2018 US Stock One-day MACD Screener Signals
- MACD line crosses above MACD signal – Bullish trend
- MACD line crosses above zero line – Bullish trend
- MACD Histogram +ve Divergence – Bullish trend
- MACD line crosses below MACD signal – Bearish trend
- MACD line crosses below zero line – Bearish trend
- MACD Histogram -ve Divergence – Bearish trend
| Ticker | Company | Date | Bullish/Bearish | Close | Vol.(K) | Screening Result |
| BAC | Bank of America Corporation | 5/4/2018 | Bullish | 30.32 | 55411 | MACD Cross-Up Signal |
| FB | Facebook, Inc. | 5/4/2018 | Bullish | 159.34 | 40916 | MACD Cross-Up Signal |
| AAPL | Apple Inc. | 5/4/2018 | Bullish | 172.8 | 26616 | MACD Cross-Up Signal |
| TSLA | Tesla, Inc. | 5/4/2018 | Bullish | 305.72 | 18991 | MACD Cross-Up Signal |
| ORCL | Oracle Corporation | 5/4/2018 | Bullish | 45.96 | 12271 | MACD Cross-Up Signal |
| KO | Coca-Cola Company (The) | 5/4/2018 | Bullish | 44.4 | 11523 | MACD Cross-Up ZeroLine |
| MS | Morgan Stanley | 5/4/2018 | Bullish | 54.86 | 9776 | MACD Cross-Up Signal |
| MO | Altria Group | 5/4/2018 | Bullish | 64.54 | 8003 | MACD Cross-Up ZeroLine |
| MGM | MGM Resorts International | 5/4/2018 | Bullish | 35.57 | 7898 | MACD Cross-Up Signal |
| CVX | Chevron Corporation | 5/4/2018 | Bullish | 117.29 | 6964 | MACD Cross-Up ZeroLine |
| V | Visa Inc. | 5/4/2018 | Bullish | 121.19 | 6788 | MACD Cross-Up Signal |
| SBUX | Starbucks Corporation | 5/4/2018 | Bullish | 59.14 | 6279 | MACD Cross-Up Signal |
| MET | MetLife, Inc. | 5/4/2018 | Bullish | 46.03 | 5721 | MACD Cross-Up Signal |
| DVN | Devon Energy Corporation | 5/4/2018 | Bullish | 32.29 | 5636 | MACD Cross-Up Signal |
| CFG | Citizens Financial Group, Inc. | 5/4/2018 | Bullish | 43.02 | 5219 | MACD Cross-Up Signal |
| BBT | BB&T Corporation | 5/4/2018 | Bullish | 52.89 | 4683 | MACD Cross-Up Signal |
| ICPT | Intercept Pharmaceuticals, Inc. | 5/4/2018 | Bullish | 70.76 | 4645 | MACD Cross-Up ZeroLine |
| HOLX | Hologic, Inc. | 5/4/2018 | Bullish | 37.45 | 4626 | MACD Cross-Up Signal |
| CAT | Caterpillar, Inc. | 5/4/2018 | Bullish | 148.13 | 4520 | MACD Cross-Up Signal |
| MAS | Masco Corporation | 5/4/2018 | Bullish | 40.93 | 4285 | MACD Cross-Up Signal |
| FITB | Fifth Third Bancorp | 5/4/2018 | Bullish | 32.33 | 4166 | MACD Cross-Up Signal |
| BAX | Baxter International Inc. | 5/4/2018 | Bullish | 65.52 | 3857 | MACD Cross-Up Signal |
| NUE | Nucor Corporation | 5/4/2018 | Bullish | 63.1 | 3853 | MACD Cross-Up Signal |
| NBL | Noble Energy Inc. | 5/4/2018 | Bullish | 30.33 | 3791 | MACD Cross-Up ZeroLine |
| VLO | Valero Energy Corporation | 5/4/2018 | Bullish | 95.86 | 3755 | MACD Cross-Up Signal |
| SYY | Sysco Corporation | 5/4/2018 | Bullish | 60.31 | 3722 | MACD Cross-Up ZeroLine |
| WY | Weyerhaeuser Company | 5/4/2018 | Bullish | 35.74 | 3422 | MACD Cross-Up ZeroLine |
| UNH | UnitedHealth Group Incorporated | 5/4/2018 | Bullish | 229.07 | 3293 | MACD Cross-Up ZeroLine |
| MON | Monsanto Company | 5/4/2018 | Bullish | 118.05 | 3290 | MACD Cross-Up Signal |
| NLSN | Nielsen N.V. | 5/4/2018 | Bullish | 32.21 | 3217 | MACD Cross-Up Signal |
| IBM | International Business Machines Corporation | 5/4/2018 | Bullish | 154.03 | 3138 | MACD Cross-Up Signal |
| UAL | United Continental Holdings, Inc. | 5/4/2018 | Bullish | 70.69 | 3003 | MACD Cross-Up Signal |
| TLT | iShares 20+ Year Treasury Bond ETF | 5/4/2018 | Bearish | 119.79 | 7599 | MACD Cross-Down Signal |
Have fun!Users must understand what MACD is all about before using the results.
Moses US Stock Scan
AmiBroker Academy.com
Disclaimer:
The above result is for illustration purpose. It is not meant to be used for buy or sell decision. We do not recommend any particular stocks. If particular stocks of such are mentioned, they are meant as demonstration of Amibroker as a powerful charting software and MACD. Amibroker can program to scan the stocks for buy and sell signals.
These are script generated signals. Not all scan results are shown here. The MACD signal should use with price action. Users must understand what MACD and price action are all about before using them. If necessary you should attend a course to learn more on Technical Analysis (TA) and Moving Average Convergence Divergence, MACD.
Once again, the website does not guarantee any results or investment return based on the information and instruction you have read here. It should be used as learning aids only and if you decide to trade real money, all trading decision should be your own.