September 20, 2016
September 20 2016 One-Day Singapore Stock MACD Free Scan
MACD signals provide clue for stock or stocks might be changing trend as compare to those that do not have any signal.
MACD Scan Results
Four Possible MACD Entry Strategies:
There are four possible entry strategies if you will using MACD indicator. However, even with the MACD signals, we will advice you to wait for confirmation to reduce possible whipsaw.
See other posting on how to trade the MACD signals.
Have fun!
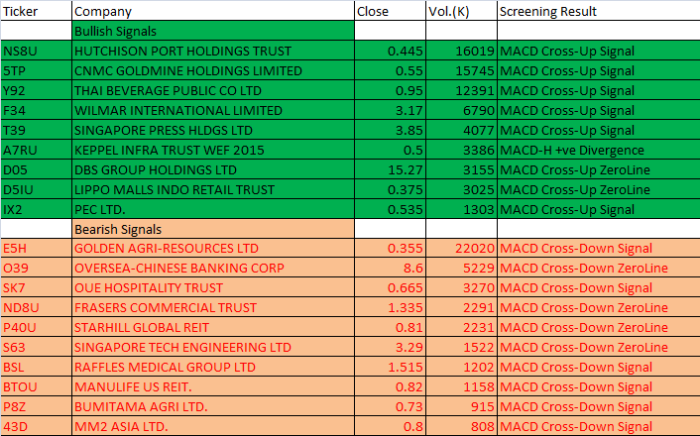
| Ticker | Company | Close | Vol.(K) | Screening Result |
| Bullish Signals | ||||
| NS8U | HUTCHISON PORT HOLDINGS TRUST | 0.445 | 16019 | MACD Cross-Up Signal |
| 5TP | CNMC GOLDMINE HOLDINGS LIMITED | 0.55 | 15745 | MACD Cross-Up Signal |
| Y92 | THAI BEVERAGE PUBLIC CO LTD | 0.95 | 12391 | MACD Cross-Up Signal |
| F34 | WILMAR INTERNATIONAL LIMITED | 3.17 | 6790 | MACD Cross-Up Signal |
| T39 | SINGAPORE PRESS HLDGS LTD | 3.85 | 4077 | MACD Cross-Up Signal |
| A7RU | KEPPEL INFRA TRUST WEF 2015 | 0.5 | 3386 | MACD-H +ve Divergence |
| D05 | DBS GROUP HOLDINGS LTD | 15.27 | 3155 | MACD Cross-Up ZeroLine |
| D5IU | LIPPO MALLS INDO RETAIL TRUST | 0.375 | 3025 | MACD Cross-Up ZeroLine |
| IX2 | PEC LTD. | 0.535 | 1303 | MACD Cross-Up Signal |
| Bearish Signals | ||||
| E5H | GOLDEN AGRI-RESOURCES LTD | 0.355 | 22020 | MACD Cross-Down Signal |
| O39 | OVERSEA-CHINESE BANKING CORP | 8.6 | 5229 | MACD Cross-Down ZeroLine |
| SK7 | OUE HOSPITALITY TRUST | 0.665 | 3270 | MACD Cross-Down Signal |
| ND8U | FRASERS COMMERCIAL TRUST | 1.335 | 2291 | MACD Cross-Down ZeroLine |
| P40U | STARHILL GLOBAL REIT | 0.81 | 2231 | MACD Cross-Down ZeroLine |
| S63 | SINGAPORE TECH ENGINEERING LTD | 3.29 | 1522 | MACD Cross-Down ZeroLine |
| BSL | RAFFLES MEDICAL GROUP LTD | 1.515 | 1202 | MACD Cross-Down Signal |
| BTOU | MANULIFE US REIT. | 0.82 | 1158 | MACD Cross-Down Signal |
| P8Z | BUMITAMA AGRI LTD. | 0.73 | 915 | MACD Cross-Down Signal |
| 43D | MM2 ASIA LTD. | 0.8 | 808 | MACD Cross-Down Signal |
MACD and Possible Trading Opportunities
These are the four possible entry strategies if you will using MACD indicator.
- Crossovers – Sell Strategy, MACD crosses below the signal line. Buy Strategy, MACD rallies above the signal line.
- Divergence – The security price action diverges or converges from the MACD or MACD Histogram. It signals the end of the current trend.
- Cross Zero Line – MACD moves above or below zero line. Upward trend: Cross above zero line, short MA above long MA. Downward trend: Cross below zero line, short MA below long MA.
- Dramatic rise or fall – MACD rises or decline dramatically – when the shorter moving average pulls away from the longer-term moving average – Oversold or Overbought.
However, even with the MACD signals, we will advice you to wait for confirmation to reduce possible whipsaw.
Have fun!
September 20, 2016 Singapore Stock MACD Scan Results
Moses Singapore Stock MACD Scan
AmiBrokerAcademy.com