Welcome to AmiBrokerAcademy.com.
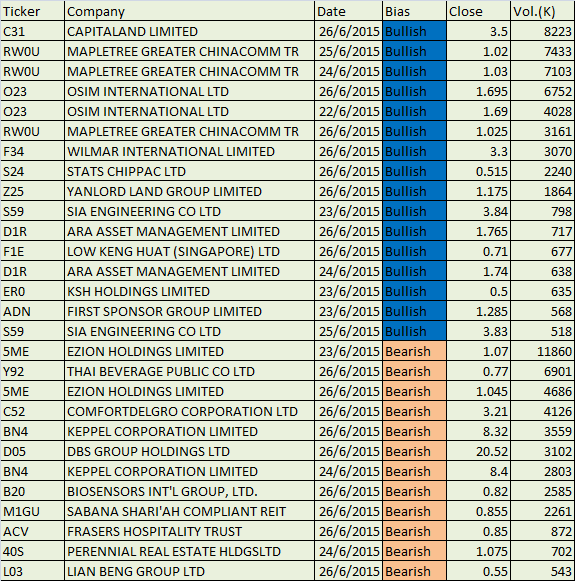
Although have more bullish signal stocks than bearish stocks, the Singapore stocks market benchmark Straits Times Index continue to travel south.
How do I trade in this case? Many of our analysis showed how to use moving average as an indicator for buy or sell trade, check out the past analysis for more information.
Singapore Stocks MACD Weekly Scan Results for Week June 22 to 26
MACD stands for Moving Average Convergence Divergence. The indicator is made up of 2 lines.
On this post, we provide list of Singapore stocks based on stocks more than fifty (50) cents and has 500,000 shares changed hands
- MACD line crosses above MACD signal – Bullish trend
- MACD line crosses above zero line – Bullish trend
- MACD Histogram +ve Divergence – Bullish trend
- MACD line crosses below MACD signal – Bearish trend
- MACD line crosses below zero line – Bearish trend
- MACD Histogram -ve Divergence – Bearish trend
You can read about other Singapore Stocks daily and weekly and daily scan results in this website.
Thanks for visiting the website.
Moses
DISCLAIMER
Site advice, “Stock trading is not a get rich quick scheme and it is high risk”.
Information provided here is of the nature of a general comment only and no intend to be specific for trading advice. It has prepared without regard to any particular investment objectives, financial situation or needs. Information should NOT be considered as an offer or enticement to buy, sell or trade.
You should seek advice from your broker, or licensed investment advisor, before taking any action.
The website does not guarantee any results or investment return based on the information and instruction you have read here. It should be used as learning aids.