March 21, 2015
Big Picture
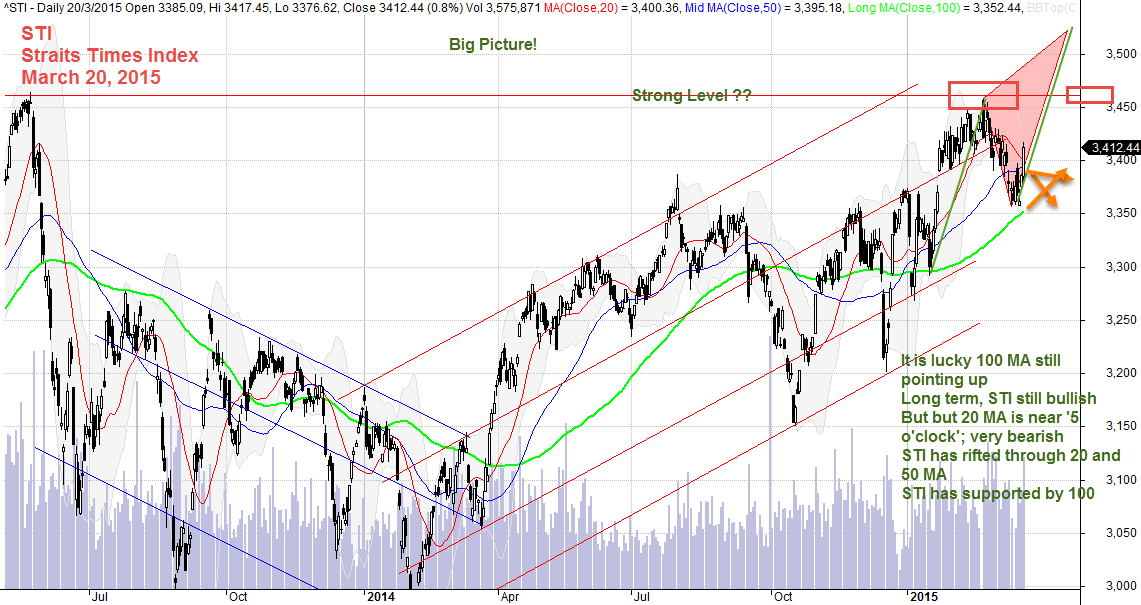
Bar by Bar, besides reading the chart bar by bar for short and immediate term. You should always step back and look at the big picture. By the big picture you will find the long term picture. 3460 is a important level to break. When it break it will be able to travel north. When start to move north, what is the likely level STI will take a break. See that triangle, AB = CD. This is where you might want to take some profit.
From a geometry AB = CD pattern, the long term strategy look bullish and will break up 3460 level. So, plan your trade trade your plan.
Remember, all setup can fail. Trade with eyes open.
March 20, 1015 Straits Times Index, STI
Thanks for visiting this extra ordinary site, AmiBrokerAcademy.com.
Watch this space here, some great stock will be analyse here. See you more.
Moses
DISCLAIMER
Stock trading is not a get rich quick scheme and it is high risk.
Information provided here is of the nature of a general comment only and no intend to be specific for trading advice. It has prepared without regard to any particular investment objectives, financial situation or needs. Information should NOT be considered as an offer or enticement to buy, sell or trade.
You should seek advice from your broker, or licensed investment advisor, before taking any action.
Once again, the website does not guarantee any results or investment return based on the information and instruction you have read here. It should be used as learning aids.
Trading is personal. You are responsible for your own trading decision.
The comment is the author personal experience. There is no intent for your believe and follow.