31 May, 2018
Thank you for visiting the site. Hope you like the content.
Singapore Stock Index STI Charting
See chart for the Singapore Stock Index, STI, The Straits Times Index picture worth a thousand words. What come to your mind? See the levels, 3450, 3550, and 3600. If you look further left you may find some interesting answer. Next check on the channel boxes. Interesting right? The price action can get out of these channel boxes. Means what? Think.
Manage your risk.
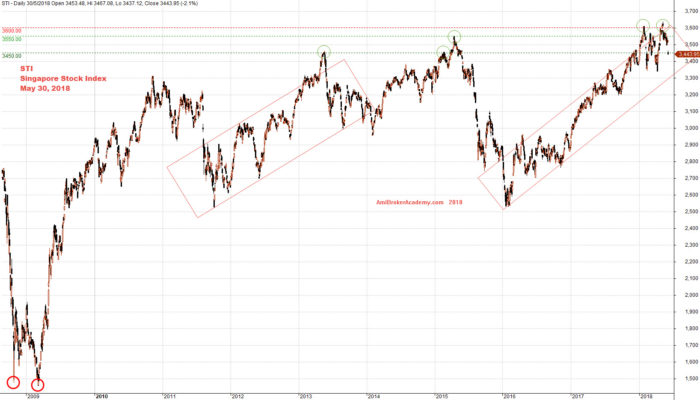
May 30, 2018 Singapore Stock Index ST Index Charting
Free MACD Scan One-day Singapore Stock MACD Screening Results on May 28 2018
Remember all setup can fail. This is true for all indicators. It is also true for MACD signals setup. See some of the MACD setup fail examples on this website.
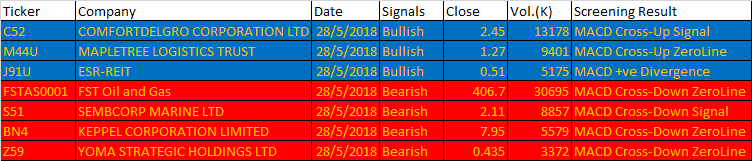
May 28, 2018 Singapore Stock 1-day MACDScan Signals
These are the six types of MACD Signals:
- MACD line crosses above MACD signal – Bullish trend
- MACD line crosses above zero line – Bullish trend
- MACD Histogram +ve Divergence – Bullish trend
- MACD line crosses below MACD signal – Bearish trend
- MACD line crosses below zero line – Bearish trend
- MACD Histogram -ve Divergence – Bearish trend
| Ticker | Company | Date | Signals | Close | Vol.(K) | Screening Result |
| C52 | COMFORTDELGRO CORPORATION LTD | 28/5/2018 | Bullish | 2.45 | 13178 | MACD Cross-Up Signal |
| M44U | MAPLETREE LOGISTICS TRUST | 28/5/2018 | Bullish | 1.27 | 9401 | MACD Cross-Up ZeroLine |
| J91U | ESR-REIT | 28/5/2018 | Bullish | 0.51 | 5175 | MACD +ve Divergence |
| FSTAS0001 | FST Oil and Gas | 28/5/2018 | Bearish | 406.7 | 30695 | MACD Cross-Down ZeroLine |
| S51 | SEMBCORP MARINE LTD | 28/5/2018 | Bearish | 2.11 | 8857 | MACD Cross-Down Signal |
| BN4 | KEPPEL CORPORATION LIMITED | 28/5/2018 | Bearish | 7.95 | 5579 | MACD Cross-Down ZeroLine |
| Z59 | YOMA STRATEGIC HOLDINGS LTD | 28/5/2018 | Bearish | 0.435 | 3372 | MACD Cross-Down ZeroLine |
Moses Singapore Stock Scan
AmiBroker Academy.com
Disclaimer:
The above result is for illustration purpose. It is not meant to be used for buy or sell decision. We do not recommend any particular stocks. If particular stocks of such are mentioned, they are meant as demonstration of Amibroker as a powerful charting software and MACD. Amibroker can program to scan the stocks for buy and sell signals.
These are script generated signals. Not all scan results are shown here. The MACD signal should use with price action. Users must understand what MACD and price action are all about before using them. If necessary you should attend a course to learn more on Technical Analysis (TA) and Moving Average Convergence Divergence, MACD.
Once again, the website does not guarantee any results or investment return based on the information and instruction you have read here. It should be used as learning aids only and if you decide to trade real money, all trading decision should be your own.