31 May, 2018
Thank you for visiting the site. Hope you like the content.
^NYA NYSE Composite Index Charting
Picture worth a thousand words, see chart price action after the peak in January this year, the price action has been going lower. See the last two triangles, downflow follow a bullish ABCD pattern; ABCD sell pattern. Manage your trade.
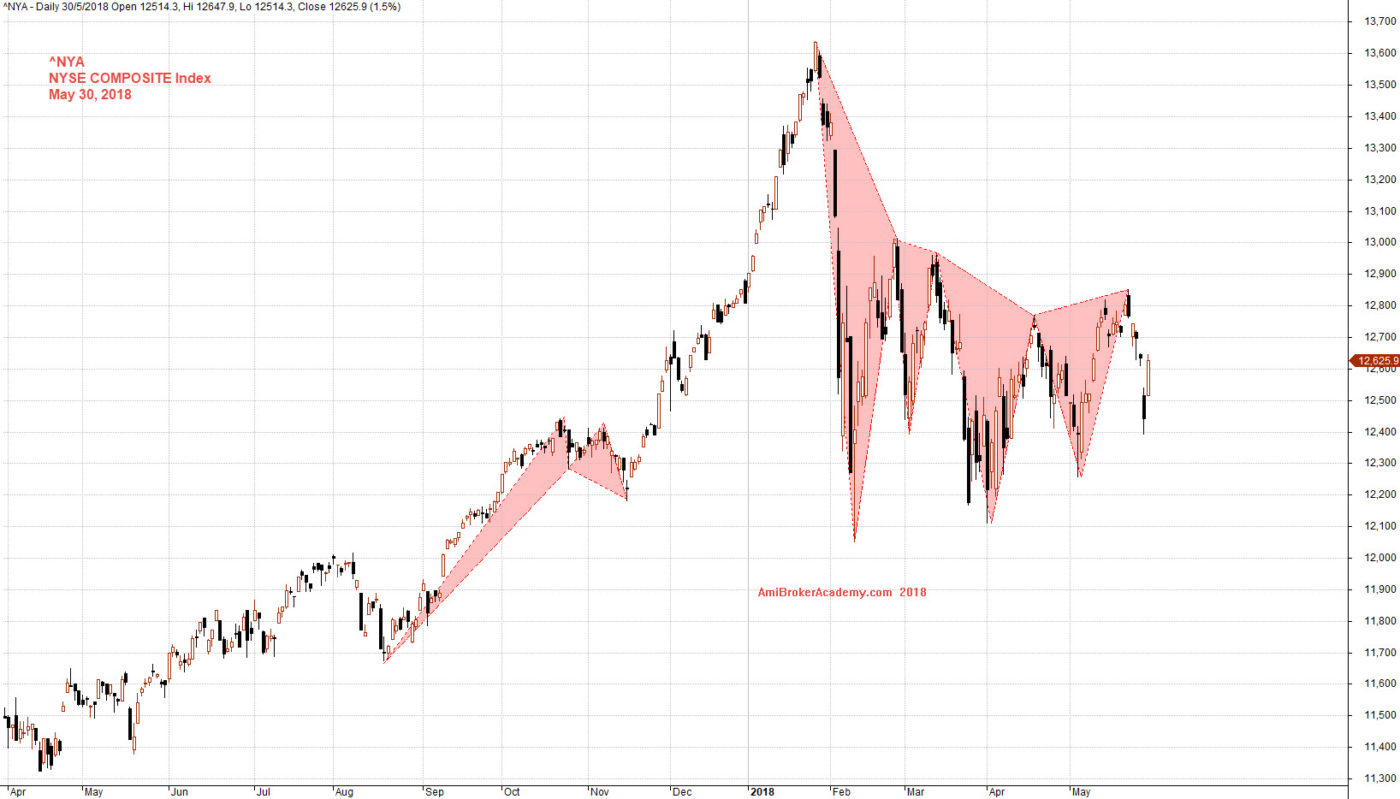
May 30, 2018 NYSE Composite Index Charting
Free MACD Scan One-day US Stock MACD Screening Results on May 30 2018
Remember all setup can fail. This is true for all indicators. It is also true for MACD signals setup.
But, even the setup can fail. Without the MACD scan results, how to find a stock might moves in the near eight thousand stocks market. The MACD signals at least reduce the among the stocks you need to study and make your trade plan.
Manage your risk.
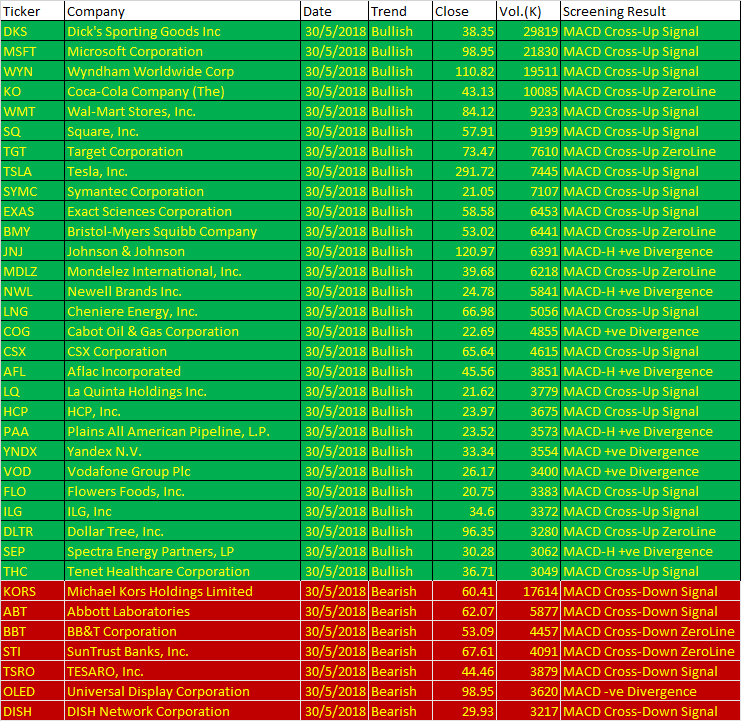
May 30, 2018 US Stock 1 day MACD Scan
These are the six types of MACD Signals:
- MACD line crosses above MACD signal – Bullish trend
- MACD line crosses above zero line – Bullish trend
- MACD Histogram +ve Divergence – Bullish trend
- MACD line crosses below MACD signal – Bearish trend
- MACD line crosses below zero line – Bearish trend
- MACD Histogram -ve Divergence – Bearish trend
| Ticker | Company | Date | Trend | Close | Vol.(K) | Screening Result |
| DKS | Dick’s Sporting Goods Inc | 30/5/2018 | Bullish | 38.35 | 29819 | MACD Cross-Up Signal |
| MSFT | Microsoft Corporation | 30/5/2018 | Bullish | 98.95 | 21830 | MACD Cross-Up Signal |
| WYN | Wyndham Worldwide Corp | 30/5/2018 | Bullish | 110.82 | 19511 | MACD Cross-Up Signal |
| KO | Coca-Cola Company (The) | 30/5/2018 | Bullish | 43.13 | 10085 | MACD Cross-Up ZeroLine |
| WMT | Wal-Mart Stores, Inc. | 30/5/2018 | Bullish | 84.12 | 9233 | MACD Cross-Up Signal |
| SQ | Square, Inc. | 30/5/2018 | Bullish | 57.91 | 9199 | MACD Cross-Up Signal |
| TGT | Target Corporation | 30/5/2018 | Bullish | 73.47 | 7610 | MACD Cross-Up ZeroLine |
| TSLA | Tesla, Inc. | 30/5/2018 | Bullish | 291.72 | 7445 | MACD Cross-Up Signal |
| SYMC | Symantec Corporation | 30/5/2018 | Bullish | 21.05 | 7107 | MACD Cross-Up Signal |
| EXAS | Exact Sciences Corporation | 30/5/2018 | Bullish | 58.58 | 6453 | MACD Cross-Up Signal |
| BMY | Bristol-Myers Squibb Company | 30/5/2018 | Bullish | 53.02 | 6441 | MACD Cross-Up ZeroLine |
| JNJ | Johnson & Johnson | 30/5/2018 | Bullish | 120.97 | 6391 | MACD-H +ve Divergence |
| MDLZ | Mondelez International, Inc. | 30/5/2018 | Bullish | 39.68 | 6218 | MACD Cross-Up ZeroLine |
| NWL | Newell Brands Inc. | 30/5/2018 | Bullish | 24.78 | 5841 | MACD-H +ve Divergence |
| LNG | Cheniere Energy, Inc. | 30/5/2018 | Bullish | 66.98 | 5056 | MACD Cross-Up Signal |
| COG | Cabot Oil & Gas Corporation | 30/5/2018 | Bullish | 22.69 | 4855 | MACD +ve Divergence |
| CSX | CSX Corporation | 30/5/2018 | Bullish | 65.64 | 4615 | MACD Cross-Up Signal |
| AFL | Aflac Incorporated | 30/5/2018 | Bullish | 45.56 | 3851 | MACD-H +ve Divergence |
| LQ | La Quinta Holdings Inc. | 30/5/2018 | Bullish | 21.62 | 3779 | MACD Cross-Up Signal |
| HCP | HCP, Inc. | 30/5/2018 | Bullish | 23.97 | 3675 | MACD Cross-Up Signal |
| PAA | Plains All American Pipeline, L.P. | 30/5/2018 | Bullish | 23.52 | 3573 | MACD-H +ve Divergence |
| YNDX | Yandex N.V. | 30/5/2018 | Bullish | 33.34 | 3554 | MACD +ve Divergence |
| VOD | Vodafone Group Plc | 30/5/2018 | Bullish | 26.17 | 3400 | MACD +ve Divergence |
| FLO | Flowers Foods, Inc. | 30/5/2018 | Bullish | 20.75 | 3383 | MACD Cross-Up Signal |
| ILG | ILG, Inc | 30/5/2018 | Bullish | 34.6 | 3372 | MACD Cross-Up Signal |
| DLTR | Dollar Tree, Inc. | 30/5/2018 | Bullish | 96.35 | 3280 | MACD Cross-Up ZeroLine |
| SEP | Spectra Energy Partners, LP | 30/5/2018 | Bullish | 30.28 | 3062 | MACD-H +ve Divergence |
| THC | Tenet Healthcare Corporation | 30/5/2018 | Bullish | 36.71 | 3049 | MACD Cross-Up Signal |
| KORS | Michael Kors Holdings Limited | 30/5/2018 | Bearish | 60.41 | 17614 | MACD Cross-Down Signal |
| ABT | Abbott Laboratories | 30/5/2018 | Bearish | 62.07 | 5877 | MACD Cross-Down Signal |
| BBT | BB&T Corporation | 30/5/2018 | Bearish | 53.09 | 4457 | MACD Cross-Down ZeroLine |
| STI | SunTrust Banks, Inc. | 30/5/2018 | Bearish | 67.61 | 4091 | MACD Cross-Down ZeroLine |
| TSRO | TESARO, Inc. | 30/5/2018 | Bearish | 44.46 | 3879 | MACD Cross-Down Signal |
| OLED | Universal Display Corporation | 30/5/2018 | Bearish | 98.95 | 3620 | MACD -ve Divergence |
| DISH | DISH Network Corporation | 30/5/2018 | Bearish | 29.93 | 3217 | MACD Cross-Down Signal |
Moses US Stock ScanYou must understand what MACD is all about before using the results.
AmiBroker Academy.com
Disclaimer:
The above result is for illustration purpose. It is not meant to be used for buy or sell decision. We do not recommend any particular stocks. If particular stocks of such are mentioned, they are meant as demonstration of Amibroker as a powerful charting software and MACD. Amibroker can program to scan the stocks for buy and sell signals.
These are script generated signals. Not all scan results are shown here. The MACD signal should use with price action. Users must understand what MACD and price action are all about before using them. If necessary you should attend a course to learn more on Technical Analysis (TA) and Moving Average Convergence Divergence, MACD.
Once again, the website does not guarantee any results or investment return based on the information and instruction you have read here. It should be used as learning aids only and if you decide to trade real money, all trading decision should be your own.