March 6, 2020
Welcome to AmiBroker Academy. Thanks for visiting the site.
Our database captures near seven hundred stocks that listed in the Singapore stock markets. You can be very diligent to research and have very good broker to help, and to really knows ten stocks or maybe just five. May be for you, but for me it is really hard.
You could ignore all the rest of the near seven hundred stocks. You actually miss all the possible trading opportunities.
So, truly speaking you need a short-cut, A short-cut to find you good stocks, or from a trader view money making stock to trade. Imagine any investment you make, and you have your capital lock down for six months or more. This is very very painful.
If you can find a tool, like MACD screener to help to identify the stocks have bull or bear bias signals. This save a lot of time. After you got the stock list like below, you can screen them again one by one to find a real trading opportunities. How good!
MACD scanner script is written using AmiBroker AFL based upon the following MACD indicator rules.
There are Six types of MACD Signals:
- MACD line crosses above MACD signal – Bullish trend
- MACD line crosses above zero line – Bullish trend
- MACD Histogram +ve Divergence – Bullish trend
- MACD line crosses below MACD signal – Bearish trend
- MACD line crosses below zero line – Bearish trend
- MACD Histogram -ve Divergence – Bearish trend
Moving Average Convergence Divergence, MACD
MACD was developed by Gerald Appel in the late seventies.
- MACD stands for Moving Average Convergence Divergence, the MACD line (red line or called fast line) and MACD signal line (blue line, or called slow line).
- MACD Bullish Signal Line Cross: MACD bullish signal when red line crosses above the blue line or MACD line crosses above zero line.
- MACD Bearish Signal Line Cross: MACD bearish signal when blue line crosses below red line or MACD line crosses below zero line.
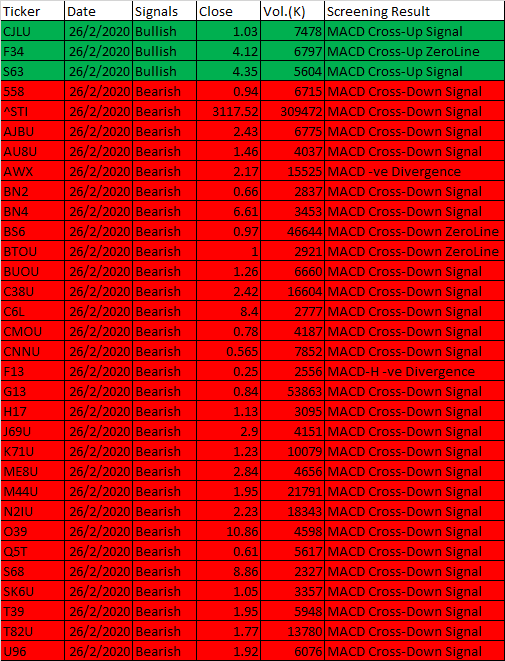
MACD Scan
These are stocks picked for today.
Free Moses MACD Scan One-day Singapore Stock MACD Screening Results on February 26, 2020
| Ticker | Date | Signals | Close | Vol.(K) | Screening Result |
| CJLU | 26/2/2020 | Bullish | 1.03 | 7478 | MACD Cross-Up Signal |
| F34 | 26/2/2020 | Bullish | 4.12 | 6797 | MACD Cross-Up ZeroLine |
| S63 | 26/2/2020 | Bullish | 4.35 | 5604 | MACD Cross-Up Signal |
| 558 | 26/2/2020 | Bearish | 0.94 | 6715 | MACD Cross-Down Signal |
| ^STI | 26/2/2020 | Bearish | 3117.52 | 309472 | MACD Cross-Down Signal |
| AJBU | 26/2/2020 | Bearish | 2.43 | 6775 | MACD Cross-Down Signal |
| AU8U | 26/2/2020 | Bearish | 1.46 | 4037 | MACD Cross-Down Signal |
| AWX | 26/2/2020 | Bearish | 2.17 | 15525 | MACD -ve Divergence |
| BN2 | 26/2/2020 | Bearish | 0.66 | 2837 | MACD Cross-Down Signal |
| BN4 | 26/2/2020 | Bearish | 6.61 | 3453 | MACD Cross-Down Signal |
| BS6 | 26/2/2020 | Bearish | 0.97 | 46644 | MACD Cross-Down ZeroLine |
| BTOU | 26/2/2020 | Bearish | 1 | 2921 | MACD Cross-Down ZeroLine |
| BUOU | 26/2/2020 | Bearish | 1.26 | 6660 | MACD Cross-Down Signal |
| C38U | 26/2/2020 | Bearish | 2.42 | 16604 | MACD Cross-Down Signal |
| C6L | 26/2/2020 | Bearish | 8.4 | 2777 | MACD Cross-Down Signal |
| CMOU | 26/2/2020 | Bearish | 0.78 | 4187 | MACD Cross-Down Signal |
| CNNU | 26/2/2020 | Bearish | 0.565 | 7852 | MACD Cross-Down Signal |
| F13 | 26/2/2020 | Bearish | 0.25 | 2556 | MACD-H -ve Divergence |
| G13 | 26/2/2020 | Bearish | 0.84 | 53863 | MACD Cross-Down Signal |
| H17 | 26/2/2020 | Bearish | 1.13 | 3095 | MACD Cross-Down Signal |
| J69U | 26/2/2020 | Bearish | 2.9 | 4151 | MACD Cross-Down Signal |
| K71U | 26/2/2020 | Bearish | 1.23 | 10079 | MACD Cross-Down Signal |
| ME8U | 26/2/2020 | Bearish | 2.84 | 4656 | MACD Cross-Down Signal |
| M44U | 26/2/2020 | Bearish | 1.95 | 21791 | MACD Cross-Down Signal |
| N2IU | 26/2/2020 | Bearish | 2.23 | 18343 | MACD Cross-Down Signal |
| O39 | 26/2/2020 | Bearish | 10.86 | 4598 | MACD Cross-Down Signal |
| Q5T | 26/2/2020 | Bearish | 0.61 | 5617 | MACD Cross-Down Signal |
| S68 | 26/2/2020 | Bearish | 8.86 | 2327 | MACD Cross-Down Signal |
| SK6U | 26/2/2020 | Bearish | 1.05 | 3357 | MACD Cross-Down Signal |
| T39 | 26/2/2020 | Bearish | 1.95 | 5948 | MACD Cross-Down Signal |
| T82U | 26/2/2020 | Bearish | 1.77 | 13780 | MACD Cross-Down Signal |
| U96 | 26/2/2020 | Bearish | 1.92 | 6076 | MACD Cross-Down Signal |
Moses Singapore Stock Scan
AmiBroker Academy.com
Disclaimer:
The above result is for illustration purpose. It is not meant to be used for buy or sell decision. We do not recommend any particular stocks on our website. If particular stocks of such are mentioned, they are meant as illustration or demonstration of Amibroker as a powerful charting software or MACD scanner. Amibroker can program to scan the stocks that have MACD buy or sell signals.
These are script generated signals. Not all scan results are shown here. The MACD signal should use with price action and confirmation. Users must understand what MACD and price action are all about before using them. If necessary you should attend a course to learn more about Technical Analysis (TA) and Moving Average Convergence Divergence, MACD.
Once again, the website does not guarantee any results or investment return based on the information and instruction you have read here. It should be used as learning aids only and if you decide to trade real money, all trading decision should be your own, and you should take your own responsibility.
Besides that all setup may fail.