March 21, 2015
Geometry AB = CD
Bearish AB = CD?
Apple Inc price crossed below 20 MA, supported by 50 MA. Stock price has moved from high to low, formed a lower high. Price now supported by 20 MA. Can 20 MA hold the price? Will see. From a geometry AB = CD chart pattern, price will cross below 20 and 50 MA. If this pattern, you may wish to take some profit before 100 MA support the fall.
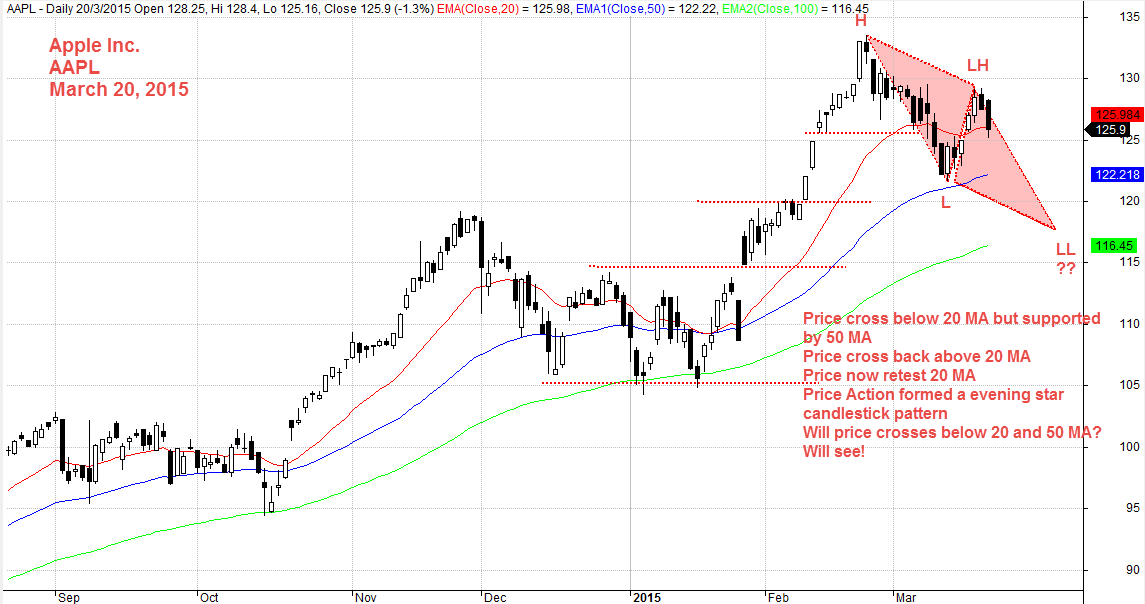
March 20, 2015 Apple Inc
Thanks for visiting this extra ordinary site, AmiBrokerAcademy.com.
Watch this space here, some great stock will be analyse here. See you more.
Moses
DISCLAIMER
Stock trading is not a get rich quick scheme and it is high risk.
Information provided here is of the nature of a general comment only and no intend to be specific for trading advice. It has prepared without regard to any particular investment objectives, financial situation or needs. Information should NOT be considered as an offer or enticement to buy, sell or trade.
You should seek advice from your broker, or licensed investment advisor, before taking any action.
Once again, the website does not guarantee any results or investment return based on the information and instruction you have read here. It should be used as learning aids.
Trading is personal. You are responsible for your own trading decision.
The comment is the author personal experience. There is no intent for your believe and follow.