March 18, 2018
Oscillator Moving Average Convergence Divergence
MACD is a popular trend following momentum indicator that shows the relationship of two moving averages of prices action; the MACD line and signal line.
Four MACD Signals:
- Crossovers – Sell Strategy, MACD crosses below the signal line. Buy Strategy, MACD rallies above the signal line. It is advisable to wait for confirmation to reduce possible whipsaw.
- Divergence – The security price action diverges from the MACD. It signals the end of the current trend.
- Cross Zero Line – MACD moves above or below zero line. Upward trend: Cross above zero line, short MA above long MA. Downward trend: Cross below zero line, short MA below long MA.
- Dramatic rise or fall – MACD rises or decline dramatically – when the shorter moving average pulls away from the longer-term moving average – Oversold or Overbought.
Free One-day US Stock MACD Screening Results for 16 March 2018
Remember all setup can fail. This is true for all indicators. It is also true for MACD signals setup. See some of the MACD setup fail examples on this website.
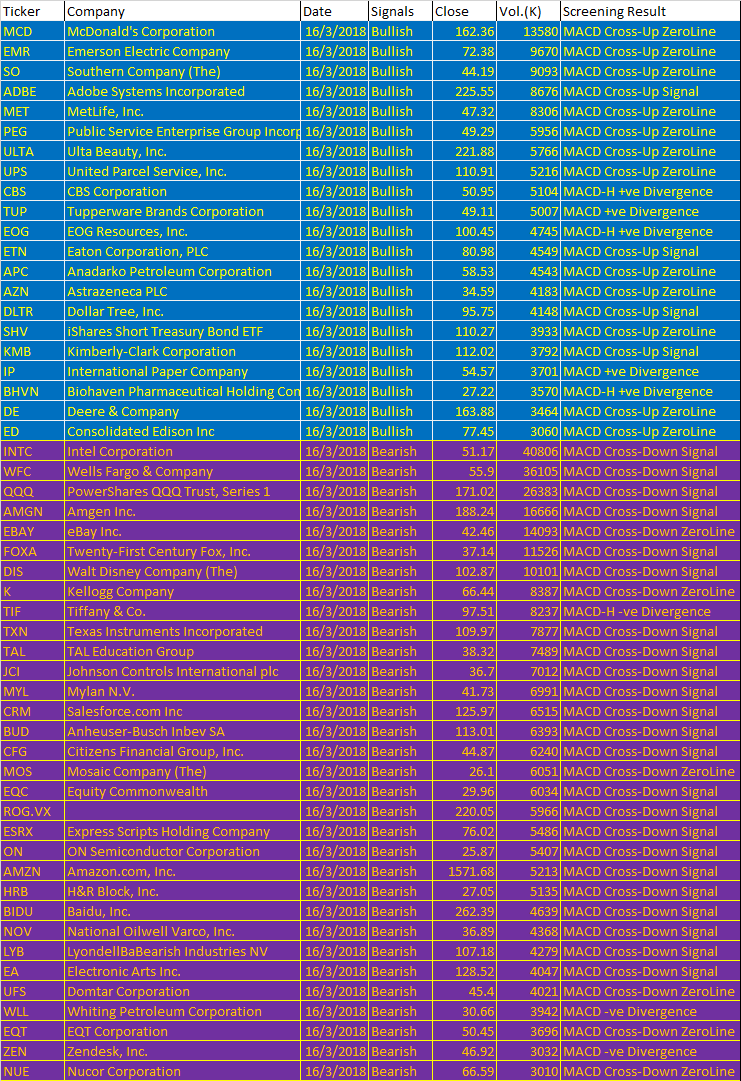
Marcg 16, 2018 US Stock One-day MACD Signals
- MACD line crosses above MACD signal – Bullish trend
- MACD line crosses above zero line – Bullish trend
- MACD Histogram +ve Divergence – Bullish trend
- MACD line crosses below MACD signal – Bearish trend
- MACD line crosses below zero line – Bearish trend
- MACD Histogram -ve Divergence – Bearish trend
| Ticker | Company | Date | Signals | Close | Vol.(K) | Screening Result |
| MCD | McDonald’s Corporation | 16/3/2018 | Bullish | 162.36 | 13580 | MACD Cross-Up ZeroLine |
| EMR | Emerson Electric Company | 16/3/2018 | Bullish | 72.38 | 9670 | MACD Cross-Up ZeroLine |
| SO | Southern Company (The) | 16/3/2018 | Bullish | 44.19 | 9093 | MACD Cross-Up ZeroLine |
| ADBE | Adobe Systems Incorporated | 16/3/2018 | Bullish | 225.55 | 8676 | MACD Cross-Up Signal |
| MET | MetLife, Inc. | 16/3/2018 | Bullish | 47.32 | 8306 | MACD Cross-Up ZeroLine |
| PEG | Public Service Enterprise Group Incorporated | 16/3/2018 | Bullish | 49.29 | 5956 | MACD Cross-Up ZeroLine |
| ULTA | Ulta Beauty, Inc. | 16/3/2018 | Bullish | 221.88 | 5766 | MACD Cross-Up ZeroLine |
| UPS | United Parcel Service, Inc. | 16/3/2018 | Bullish | 110.91 | 5216 | MACD Cross-Up ZeroLine |
| CBS | CBS Corporation | 16/3/2018 | Bullish | 50.95 | 5104 | MACD-H +ve Divergence |
| TUP | Tupperware Brands Corporation | 16/3/2018 | Bullish | 49.11 | 5007 | MACD +ve Divergence |
| EOG | EOG Resources, Inc. | 16/3/2018 | Bullish | 100.45 | 4745 | MACD-H +ve Divergence |
| ETN | Eaton Corporation, PLC | 16/3/2018 | Bullish | 80.98 | 4549 | MACD Cross-Up Signal |
| APC | Anadarko Petroleum Corporation | 16/3/2018 | Bullish | 58.53 | 4543 | MACD Cross-Up ZeroLine |
| AZN | Astrazeneca PLC | 16/3/2018 | Bullish | 34.59 | 4183 | MACD Cross-Up ZeroLine |
| DLTR | Dollar Tree, Inc. | 16/3/2018 | Bullish | 95.75 | 4148 | MACD Cross-Up Signal |
| SHV | iShares Short Treasury Bond ETF | 16/3/2018 | Bullish | 110.27 | 3933 | MACD Cross-Up ZeroLine |
| KMB | Kimberly-Clark Corporation | 16/3/2018 | Bullish | 112.02 | 3792 | MACD Cross-Up Signal |
| IP | International Paper Company | 16/3/2018 | Bullish | 54.57 | 3701 | MACD +ve Divergence |
| BHVN | Biohaven Pharmaceutical Holding Company Ltd. | 16/3/2018 | Bullish | 27.22 | 3570 | MACD-H +ve Divergence |
| DE | Deere & Company | 16/3/2018 | Bullish | 163.88 | 3464 | MACD Cross-Up ZeroLine |
| ED | Consolidated Edison Inc | 16/3/2018 | Bullish | 77.45 | 3060 | MACD Cross-Up ZeroLine |
| INTC | Intel Corporation | 16/3/2018 | Bearish | 51.17 | 40806 | MACD Cross-Down Signal |
| WFC | Wells Fargo & Company | 16/3/2018 | Bearish | 55.9 | 36105 | MACD Cross-Down Signal |
| QQQ | PowerShares QQQ Trust, Series 1 | 16/3/2018 | Bearish | 171.02 | 26383 | MACD Cross-Down Signal |
| AMGN | Amgen Inc. | 16/3/2018 | Bearish | 188.24 | 16666 | MACD Cross-Down Signal |
| EBAY | eBay Inc. | 16/3/2018 | Bearish | 42.46 | 14093 | MACD Cross-Down ZeroLine |
| FOXA | Twenty-First Century Fox, Inc. | 16/3/2018 | Bearish | 37.14 | 11526 | MACD Cross-Down Signal |
| DIS | Walt Disney Company (The) | 16/3/2018 | Bearish | 102.87 | 10101 | MACD Cross-Down Signal |
| K | Kellogg Company | 16/3/2018 | Bearish | 66.44 | 8387 | MACD Cross-Down ZeroLine |
| TIF | Tiffany & Co. | 16/3/2018 | Bearish | 97.51 | 8237 | MACD-H -ve Divergence |
| TXN | Texas Instruments Incorporated | 16/3/2018 | Bearish | 109.97 | 7877 | MACD Cross-Down Signal |
| TAL | TAL Education Group | 16/3/2018 | Bearish | 38.32 | 7489 | MACD Cross-Down Signal |
| JCI | Johnson Controls International plc | 16/3/2018 | Bearish | 36.7 | 7012 | MACD Cross-Down Signal |
| MYL | Mylan N.V. | 16/3/2018 | Bearish | 41.73 | 6991 | MACD Cross-Down Signal |
| CRM | Salesforce.com Inc | 16/3/2018 | Bearish | 125.97 | 6515 | MACD Cross-Down Signal |
| BUD | Anheuser-Busch Inbev SA | 16/3/2018 | Bearish | 113.01 | 6393 | MACD Cross-Down Signal |
| CFG | Citizens Financial Group, Inc. | 16/3/2018 | Bearish | 44.87 | 6240 | MACD Cross-Down Signal |
| MOS | Mosaic Company (The) | 16/3/2018 | Bearish | 26.1 | 6051 | MACD Cross-Down ZeroLine |
| EQC | Equity Commonwealth | 16/3/2018 | Bearish | 29.96 | 6034 | MACD Cross-Down Signal |
| ROG.VX | 16/3/2018 | Bearish | 220.05 | 5966 | MACD Cross-Down Signal | |
| ESRX | Express Scripts Holding Company | 16/3/2018 | Bearish | 76.02 | 5486 | MACD Cross-Down Signal |
| ON | ON Semiconductor Corporation | 16/3/2018 | Bearish | 25.87 | 5407 | MACD Cross-Down Signal |
| AMZN | Amazon.com, Inc. | 16/3/2018 | Bearish | 1571.68 | 5213 | MACD Cross-Down Signal |
| HRB | H&R Block, Inc. | 16/3/2018 | Bearish | 27.05 | 5135 | MACD Cross-Down Signal |
| BIDU | Baidu, Inc. | 16/3/2018 | Bearish | 262.39 | 4639 | MACD Cross-Down Signal |
| NOV | National Oilwell Varco, Inc. | 16/3/2018 | Bearish | 36.89 | 4368 | MACD Cross-Down Signal |
| LYB | LyondellBaBearish Industries NV | 16/3/2018 | Bearish | 107.18 | 4279 | MACD Cross-Down Signal |
| EA | Electronic Arts Inc. | 16/3/2018 | Bearish | 128.52 | 4047 | MACD Cross-Down Signal |
| UFS | Domtar Corporation | 16/3/2018 | Bearish | 45.4 | 4021 | MACD Cross-Down ZeroLine |
| WLL | Whiting Petroleum Corporation | 16/3/2018 | Bearish | 30.66 | 3942 | MACD -ve Divergence |
| EQT | EQT Corporation | 16/3/2018 | Bearish | 50.45 | 3696 | MACD Cross-Down ZeroLine |
| ZEN | Zendesk, Inc. | 16/3/2018 | Bearish | 46.92 | 3032 | MACD -ve Divergence |
| NUE | Nucor Corporation | 16/3/2018 | Bearish | 66.59 | 3010 | MACD Cross-Down ZeroLine |
Have fun!Users must understand what MACD is all about before using the results.
Moses US Stock Scan
AmiBroker Academy.com
Disclaimer:
The above result is for illustration purpose. It is not meant to be used for buy or sell decision. We do not recommend any particular stocks. If particular stocks of such are mentioned, they are meant as demonstration of Amibroker as a powerful charting software and MACD. Amibroker can program to scan the stocks for buy and sell signals.
These are script generated signals. Not all scan results are shown here. The MACD signal should use with price action. Users must understand what MACD and price action are all about before using them. If necessary you should attend a course to learn more on Technical Analysis (TA) and Moving Average Convergence Divergence, MACD.
Once again, the website does not guarantee any results or investment return based on the information and instruction you have read here. It should be used as learning aids only and if you decide to trade real money, all trading decision should be your own.