February 27, 2018

Gold Mandarin Orange (Photo source: from what’s apps group)
Oscillator Moving Average Convergence Divergence
MACD is a popular trend following momentum indicator that shows the relationship of two moving averages of prices action; the MACD line and signal line.
Four MACD Signals:
- Crossovers – Sell Strategy, MACD crosses below the signal line. Buy Strategy, MACD rallies above the signal line. It is advisable to wait for confirmation to reduce possible whipsaw.
- Divergence – The security price action diverges from the MACD. It signals the end of the current trend.
- Cross Zero Line – MACD moves above or below zero line. Upward trend: Cross above zero line, short MA above long MA. Downward trend: Cross below zero line, short MA below long MA.
- Dramatic rise or fall – MACD rises or decline dramatically – when the shorter moving average pulls away from the longer-term moving average – Oversold or Overbought.
Free One-day Singapore Stock MACD Screening Results for 26 February 2018
Remember all setup can fail. This is true for all indicators. It is also true for MACD signals setup. See some of the MACD setup fail examples on this website.
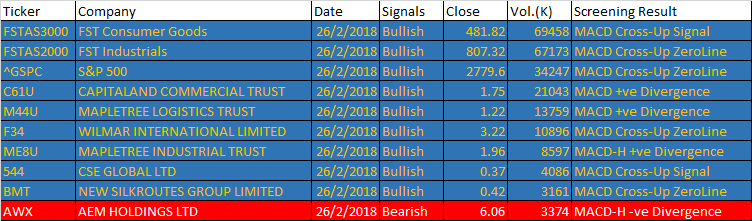
February 26, 2018 Singapore Stock One-day MACD Scan Signals
- MACD line crosses above MACD signal – Bullish trend
- MACD line crosses above zero line – Bullish trend
- MACD Histogram +ve Divergence – Bullish trend
- MACD line crosses below MACD signal – Bearish trend
- MACD line crosses below zero line – Bearish trend
- MACD Histogram -ve Divergence – Bearish trend
| Ticker | Company | Date | Signals | Close | Vol.(K) | Screening Result |
| FSTAS3000 | FST Consumer Goods | 26/2/2018 | Bullish | 481.82 | 69458 | MACD Cross-Up Signal |
| FSTAS2000 | FST Industrials | 26/2/2018 | Bullish | 807.32 | 67173 | MACD Cross-Up ZeroLine |
| ^GSPC | S&P 500 | 26/2/2018 | Bullish | 2779.6 | 34247 | MACD Cross-Up ZeroLine |
| C61U | CAPITALAND COMMERCIAL TRUST | 26/2/2018 | Bullish | 1.75 | 21043 | MACD +ve Divergence |
| M44U | MAPLETREE LOGISTICS TRUST | 26/2/2018 | Bullish | 1.22 | 13759 | MACD +ve Divergence |
| F34 | WILMAR INTERNATIONAL LIMITED | 26/2/2018 | Bullish | 3.22 | 10896 | MACD Cross-Up ZeroLine |
| ME8U | MAPLETREE INDUSTRIAL TRUST | 26/2/2018 | Bullish | 1.96 | 8597 | MACD-H +ve Divergence |
| 544 | CSE GLOBAL LTD | 26/2/2018 | Bullish | 0.37 | 4086 | MACD Cross-Up Signal |
| BMT | NEW SILKROUTES GROUP LIMITED | 26/2/2018 | Bullish | 0.42 | 3161 | MACD Cross-Up ZeroLine |
| AWX | AEM HOLDINGS LTD | 26/2/2018 | Bearish | 6.06 | 3374 | MACD-H -ve Divergence |
Have fun!Users must understand what MACD is all about before using the results.
Moses Singapore Stock MACD Screening Signals
AmiBroker Academy.com
Disclaimer:
The above result is for illustration purpose. It is not meant to be used for buy or sell decision. We do not recommend any particular stocks. If particular stocks of such are mentioned, they are meant as demonstration of Amibroker as a powerful charting software and MACD. Amibroker can program to scan the stocks for buy and sell signals.
These are script generated signals. Not all scan results are shown here. The MACD signal should use with price action. Users must understand what MACD and price action are all about before using them. If necessary you should attend a course to learn more on Technical Analysis (TA) and Moving Average Convergence Divergence, MACD.
Once again, the website does not guarantee any results or investment return based on the information and instruction you have read here. It should be used as learning aids only and if you decide to trade real money, all trading decision should be your own.