7 April, 2018
Janet Louise Yellen United States Federal Reserve System Chairman Reminded All Don’t Forget the Damage of Financial Crisis! What Can We Learn From Past Financial Crises?
Read our charts on 2018 Finance Crisis and Black Monday.
Oscillator Moving Average Convergence Divergence
MACD is a popular trend following momentum indicator that shows the relationship of two moving averages of prices action; the MACD line and signal line.
You could reference to the MACD signals to manage your trade risk.
You Could Find Four MACD Signals:
- Crossovers – Sell Strategy, MACD crosses below the signal line. Buy Strategy, MACD rallies above the signal line. It is advisable to wait for confirmation to reduce possible whipsaw.
- Divergence – The security price action diverges from the MACD. It signals the end of the current trend.
- Cross Zero Line – MACD moves above or below zero line. Upward trend: Cross above zero line, short MA above long MA. Downward trend: Cross below zero line, short MA below long MA.
- Dramatic rise or fall – MACD rises or decline dramatically – when the shorter moving average pulls away from the longer-term moving average – Oversold or Overbought.
April 4 2018 Free One-day US Stock MACD Screening Results
Remember all setup can fail. This is true for all indicators. It is also true for MACD signals setup. See some of the MACD setup fail examples on this website.
The market mode swing, there are more buy signals as compare to the April 2. Manage your risk.
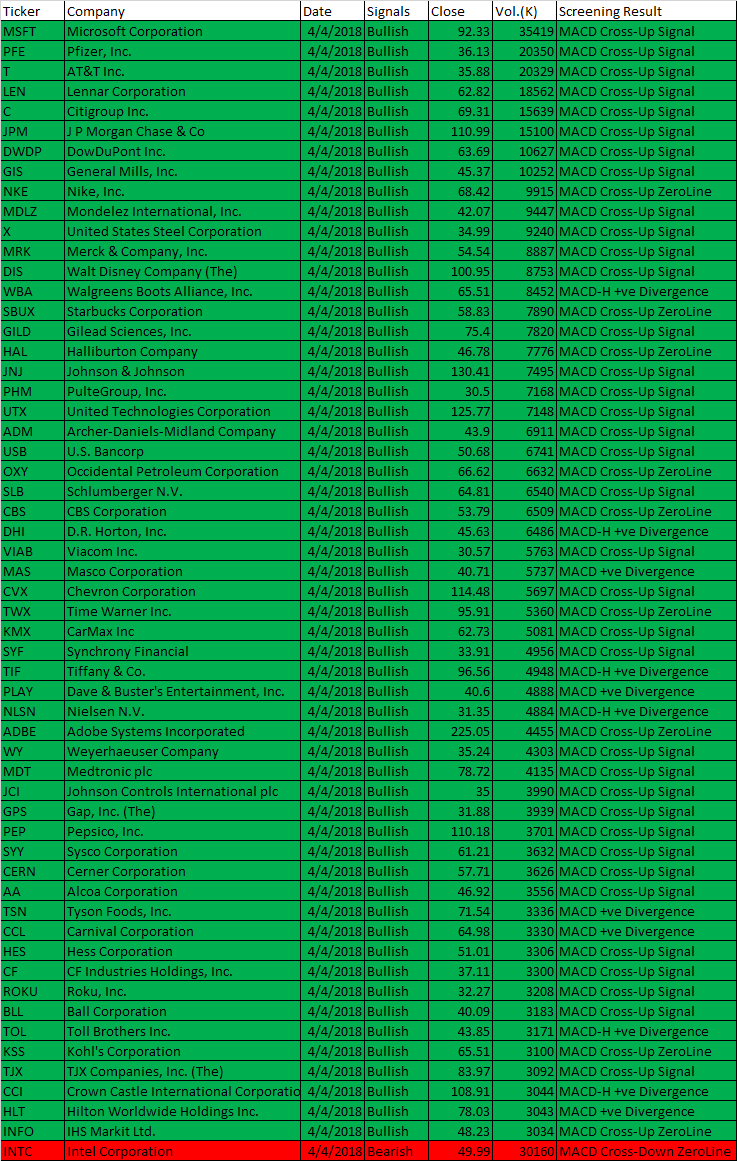
April 4, 2018 US Stock One-day MACD Signals
- MACD line crosses above MACD signal – Bullish trend
- MACD line crosses above zero line – Bullish trend
- MACD Histogram +ve Divergence – Bullish trend
- MACD line crosses below MACD signal – Bearish trend
- MACD line crosses below zero line – Bearish trend
- MACD Histogram -ve Divergence – Bearish trend
| Ticker | Company | Date | Signals | Close | Vol.(K) | Screening Result |
| MSFT | Microsoft Corporation | 4/4/2018 | Bullish | 92.33 | 35419 | MACD Cross-Up Signal |
| PFE | Pfizer, Inc. | 4/4/2018 | Bullish | 36.13 | 20350 | MACD Cross-Up Signal |
| T | AT&T Inc. | 4/4/2018 | Bullish | 35.88 | 20329 | MACD Cross-Up Signal |
| LEN | Lennar Corporation | 4/4/2018 | Bullish | 62.82 | 18562 | MACD Cross-Up Signal |
| C | Citigroup Inc. | 4/4/2018 | Bullish | 69.31 | 15639 | MACD Cross-Up Signal |
| JPM | J P Morgan Chase & Co | 4/4/2018 | Bullish | 110.99 | 15100 | MACD Cross-Up Signal |
| DWDP | DowDuPont Inc. | 4/4/2018 | Bullish | 63.69 | 10627 | MACD Cross-Up Signal |
| GIS | General Mills, Inc. | 4/4/2018 | Bullish | 45.37 | 10252 | MACD Cross-Up Signal |
| NKE | Nike, Inc. | 4/4/2018 | Bullish | 68.42 | 9915 | MACD Cross-Up ZeroLine |
| MDLZ | Mondelez International, Inc. | 4/4/2018 | Bullish | 42.07 | 9447 | MACD Cross-Up Signal |
| X | United States Steel Corporation | 4/4/2018 | Bullish | 34.99 | 9240 | MACD Cross-Up Signal |
| MRK | Merck & Company, Inc. | 4/4/2018 | Bullish | 54.54 | 8887 | MACD Cross-Up Signal |
| DIS | Walt Disney Company (The) | 4/4/2018 | Bullish | 100.95 | 8753 | MACD Cross-Up Signal |
| WBA | Walgreens Boots Alliance, Inc. | 4/4/2018 | Bullish | 65.51 | 8452 | MACD-H +ve Divergence |
| SBUX | Starbucks Corporation | 4/4/2018 | Bullish | 58.83 | 7890 | MACD Cross-Up ZeroLine |
| GILD | Gilead Sciences, Inc. | 4/4/2018 | Bullish | 75.4 | 7820 | MACD Cross-Up Signal |
| HAL | Halliburton Company | 4/4/2018 | Bullish | 46.78 | 7776 | MACD Cross-Up ZeroLine |
| JNJ | Johnson & Johnson | 4/4/2018 | Bullish | 130.41 | 7495 | MACD Cross-Up Signal |
| PHM | PulteGroup, Inc. | 4/4/2018 | Bullish | 30.5 | 7168 | MACD Cross-Up Signal |
| UTX | United Technologies Corporation | 4/4/2018 | Bullish | 125.77 | 7148 | MACD Cross-Up Signal |
| ADM | Archer-Daniels-Midland Company | 4/4/2018 | Bullish | 43.9 | 6911 | MACD Cross-Up Signal |
| USB | U.S. Bancorp | 4/4/2018 | Bullish | 50.68 | 6741 | MACD Cross-Up Signal |
| OXY | Occidental Petroleum Corporation | 4/4/2018 | Bullish | 66.62 | 6632 | MACD Cross-Up ZeroLine |
| SLB | Schlumberger N.V. | 4/4/2018 | Bullish | 64.81 | 6540 | MACD Cross-Up Signal |
| CBS | CBS Corporation | 4/4/2018 | Bullish | 53.79 | 6509 | MACD Cross-Up ZeroLine |
| DHI | D.R. Horton, Inc. | 4/4/2018 | Bullish | 45.63 | 6486 | MACD-H +ve Divergence |
| VIAB | Viacom Inc. | 4/4/2018 | Bullish | 30.57 | 5763 | MACD Cross-Up Signal |
| MAS | Masco Corporation | 4/4/2018 | Bullish | 40.71 | 5737 | MACD +ve Divergence |
| CVX | Chevron Corporation | 4/4/2018 | Bullish | 114.48 | 5697 | MACD Cross-Up Signal |
| TWX | Time Warner Inc. | 4/4/2018 | Bullish | 95.91 | 5360 | MACD Cross-Up ZeroLine |
| KMX | CarMax Inc | 4/4/2018 | Bullish | 62.73 | 5081 | MACD Cross-Up Signal |
| SYF | Synchrony Financial | 4/4/2018 | Bullish | 33.91 | 4956 | MACD Cross-Up Signal |
| TIF | Tiffany & Co. | 4/4/2018 | Bullish | 96.56 | 4948 | MACD-H +ve Divergence |
| PLAY | Dave & Buster’s Entertainment, Inc. | 4/4/2018 | Bullish | 40.6 | 4888 | MACD +ve Divergence |
| NLSN | Nielsen N.V. | 4/4/2018 | Bullish | 31.35 | 4884 | MACD-H +ve Divergence |
| ADBE | Adobe Systems Incorporated | 4/4/2018 | Bullish | 225.05 | 4455 | MACD Cross-Up ZeroLine |
| WY | Weyerhaeuser Company | 4/4/2018 | Bullish | 35.24 | 4303 | MACD Cross-Up Signal |
| MDT | Medtronic plc | 4/4/2018 | Bullish | 78.72 | 4135 | MACD Cross-Up Signal |
| JCI | Johnson Controls International plc | 4/4/2018 | Bullish | 35 | 3990 | MACD Cross-Up Signal |
| GPS | Gap, Inc. (The) | 4/4/2018 | Bullish | 31.88 | 3939 | MACD Cross-Up Signal |
| PEP | Pepsico, Inc. | 4/4/2018 | Bullish | 110.18 | 3701 | MACD Cross-Up Signal |
| SYY | Sysco Corporation | 4/4/2018 | Bullish | 61.21 | 3632 | MACD Cross-Up Signal |
| CERN | Cerner Corporation | 4/4/2018 | Bullish | 57.71 | 3626 | MACD Cross-Up Signal |
| AA | Alcoa Corporation | 4/4/2018 | Bullish | 46.92 | 3556 | MACD Cross-Up Signal |
| TSN | Tyson Foods, Inc. | 4/4/2018 | Bullish | 71.54 | 3336 | MACD +ve Divergence |
| CCL | Carnival Corporation | 4/4/2018 | Bullish | 64.98 | 3330 | MACD +ve Divergence |
| HES | Hess Corporation | 4/4/2018 | Bullish | 51.01 | 3306 | MACD Cross-Up Signal |
| CF | CF Industries Holdings, Inc. | 4/4/2018 | Bullish | 37.11 | 3300 | MACD Cross-Up Signal |
| ROKU | Roku, Inc. | 4/4/2018 | Bullish | 32.27 | 3208 | MACD Cross-Up Signal |
| BLL | Ball Corporation | 4/4/2018 | Bullish | 40.09 | 3183 | MACD Cross-Up Signal |
| TOL | Toll Brothers Inc. | 4/4/2018 | Bullish | 43.85 | 3171 | MACD-H +ve Divergence |
| KSS | Kohl’s Corporation | 4/4/2018 | Bullish | 65.51 | 3100 | MACD Cross-Up ZeroLine |
| TJX | TJX Companies, Inc. (The) | 4/4/2018 | Bullish | 83.97 | 3092 | MACD Cross-Up Signal |
| CCI | Crown Castle International Corporation | 4/4/2018 | Bullish | 108.91 | 3044 | MACD-H +ve Divergence |
| HLT | Hilton Worldwide Holdings Inc. | 4/4/2018 | Bullish | 78.03 | 3043 | MACD +ve Divergence |
| INFO | IHS Markit Ltd. | 4/4/2018 | Bullish | 48.23 | 3034 | MACD Cross-Up ZeroLine |
| INTC | Intel Corporation | 4/4/2018 | Bearish | 49.99 | 30160 | MACD Cross-Down ZeroLine |
Have fun!Users must understand what MACD is all about before using the results.
Moses US Stock Scan
AmiBroker Academy.com
Disclaimer:
The above result is for illustration purpose. It is not meant to be used for buy or sell decision. We do not recommend any particular stocks. If particular stocks of such are mentioned, they are meant as demonstration of Amibroker as a powerful charting software and MACD. Amibroker can program to scan the stocks for buy and sell signals.
These are script generated signals. Not all scan results are shown here. The MACD signal should use with price action. Users must understand what MACD and price action are all about before using them. If necessary you should attend a course to learn more on Technical Analysis (TA) and Moving Average Convergence Divergence, MACD.
Once again, the website does not guarantee any results or investment return based on the information and instruction you have read here. It should be used as learning aids only and if you decide to trade real money, all trading decision should be your own.