March 8, 2018
Oscillator Moving Average Convergence Divergence
MACD is a popular trend following momentum indicator that shows the relationship of two moving averages of prices action; the MACD line and signal line.
Four MACD Signals:
- Crossovers – Sell Strategy, MACD crosses below the signal line. Buy Strategy, MACD rallies above the signal line. It is advisable to wait for confirmation to reduce possible whipsaw.
- Divergence – The security price action diverges from the MACD. It signals the end of the current trend.
- Cross Zero Line – MACD moves above or below zero line. Upward trend: Cross above zero line, short MA above long MA. Downward trend: Cross below zero line, short MA below long MA.
- Dramatic rise or fall – MACD rises or decline dramatically – when the shorter moving average pulls away from the longer-term moving average – Oversold or Overbought.
Free One-day US Stock MACD Screening Results for 5 March 2018
Remember all setup can fail. This is true for all indicators. It is also true for MACD signals setup. See some of the MACD setup fail examples on this website.
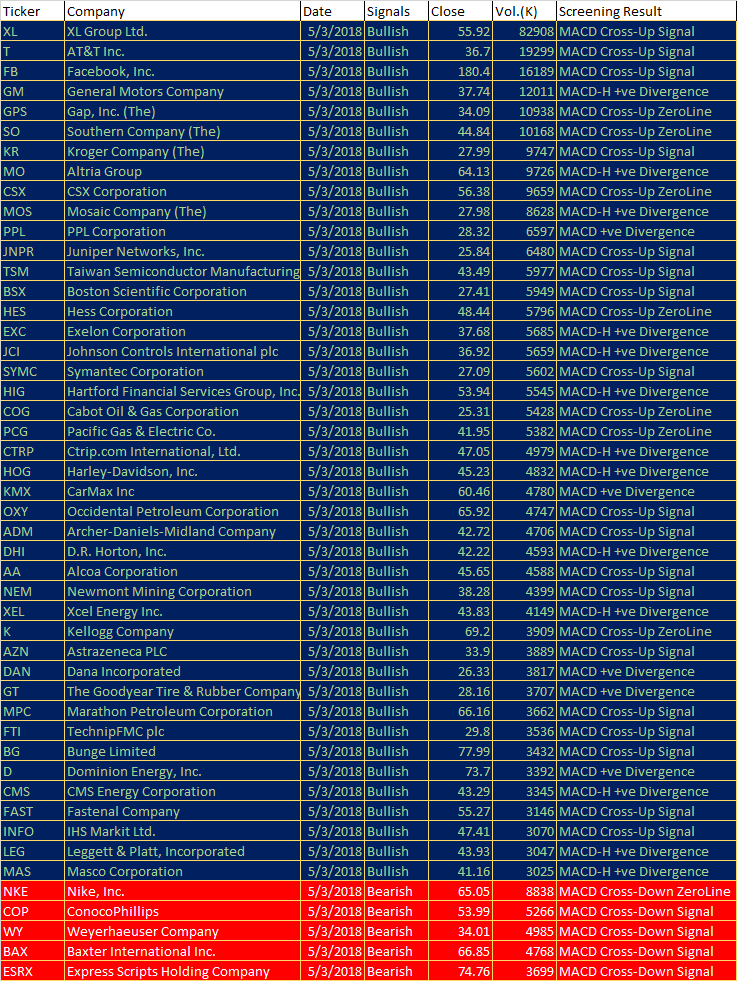
March 5, 2018 US Stock One-day MACD Screener Signals
- MACD line crosses above MACD signal – Bullish trend
- MACD line crosses above zero line – Bullish trend
- MACD Histogram +ve Divergence – Bullish trend
- MACD line crosses below MACD signal – Bearish trend
- MACD line crosses below zero line – Bearish trend
- MACD Histogram -ve Divergence – Bearish trend
| Ticker | Company | Date | Signals | Close | Vol.(K) | Screening Result |
| XL | XL Group Ltd. | 5/3/2018 | Bullish | 55.92 | 82908 | MACD Cross-Up Signal |
| T | AT&T Inc. | 5/3/2018 | Bullish | 36.7 | 19299 | MACD Cross-Up Signal |
| FB | Facebook, Inc. | 5/3/2018 | Bullish | 180.4 | 16189 | MACD Cross-Up Signal |
| GM | General Motors Company | 5/3/2018 | Bullish | 37.74 | 12011 | MACD-H +ve Divergence |
| GPS | Gap, Inc. (The) | 5/3/2018 | Bullish | 34.09 | 10938 | MACD Cross-Up ZeroLine |
| SO | Southern Company (The) | 5/3/2018 | Bullish | 44.84 | 10168 | MACD Cross-Up ZeroLine |
| KR | Kroger Company (The) | 5/3/2018 | Bullish | 27.99 | 9747 | MACD Cross-Up Signal |
| MO | Altria Group | 5/3/2018 | Bullish | 64.13 | 9726 | MACD-H +ve Divergence |
| CSX | CSX Corporation | 5/3/2018 | Bullish | 56.38 | 9659 | MACD Cross-Up ZeroLine |
| MOS | Mosaic Company (The) | 5/3/2018 | Bullish | 27.98 | 8628 | MACD-H +ve Divergence |
| PPL | PPL Corporation | 5/3/2018 | Bullish | 28.32 | 6597 | MACD +ve Divergence |
| JNPR | Juniper Networks, Inc. | 5/3/2018 | Bullish | 25.84 | 6480 | MACD Cross-Up Signal |
| TSM | Taiwan Semiconductor Manufacturing Company Ltd. | 5/3/2018 | Bullish | 43.49 | 5977 | MACD Cross-Up Signal |
| BSX | Boston Scientific Corporation | 5/3/2018 | Bullish | 27.41 | 5949 | MACD Cross-Up Signal |
| HES | Hess Corporation | 5/3/2018 | Bullish | 48.44 | 5796 | MACD Cross-Up ZeroLine |
| EXC | Exelon Corporation | 5/3/2018 | Bullish | 37.68 | 5685 | MACD-H +ve Divergence |
| JCI | Johnson Controls International plc | 5/3/2018 | Bullish | 36.92 | 5659 | MACD-H +ve Divergence |
| SYMC | Symantec Corporation | 5/3/2018 | Bullish | 27.09 | 5602 | MACD Cross-Up Signal |
| HIG | Hartford Financial Services Group, Inc. (The) | 5/3/2018 | Bullish | 53.94 | 5545 | MACD-H +ve Divergence |
| COG | Cabot Oil & Gas Corporation | 5/3/2018 | Bullish | 25.31 | 5428 | MACD Cross-Up ZeroLine |
| PCG | Pacific Gas & Electric Co. | 5/3/2018 | Bullish | 41.95 | 5382 | MACD Cross-Up ZeroLine |
| CTRP | Ctrip.com International, Ltd. | 5/3/2018 | Bullish | 47.05 | 4979 | MACD-H +ve Divergence |
| HOG | Harley-Davidson, Inc. | 5/3/2018 | Bullish | 45.23 | 4832 | MACD-H +ve Divergence |
| KMX | CarMax Inc | 5/3/2018 | Bullish | 60.46 | 4780 | MACD +ve Divergence |
| OXY | Occidental Petroleum Corporation | 5/3/2018 | Bullish | 65.92 | 4747 | MACD Cross-Up Signal |
| ADM | Archer-Daniels-Midland Company | 5/3/2018 | Bullish | 42.72 | 4706 | MACD Cross-Up Signal |
| DHI | D.R. Horton, Inc. | 5/3/2018 | Bullish | 42.22 | 4593 | MACD-H +ve Divergence |
| AA | Alcoa Corporation | 5/3/2018 | Bullish | 45.65 | 4588 | MACD Cross-Up Signal |
| NEM | Newmont Mining Corporation | 5/3/2018 | Bullish | 38.28 | 4399 | MACD Cross-Up Signal |
| XEL | Xcel Energy Inc. | 5/3/2018 | Bullish | 43.83 | 4149 | MACD-H +ve Divergence |
| K | Kellogg Company | 5/3/2018 | Bullish | 69.2 | 3909 | MACD Cross-Up ZeroLine |
| AZN | Astrazeneca PLC | 5/3/2018 | Bullish | 33.9 | 3889 | MACD Cross-Up Signal |
| DAN | Dana Incorporated | 5/3/2018 | Bullish | 26.33 | 3817 | MACD +ve Divergence |
| GT | The Goodyear Tire & Rubber Company | 5/3/2018 | Bullish | 28.16 | 3707 | MACD +ve Divergence |
| MPC | Marathon Petroleum Corporation | 5/3/2018 | Bullish | 66.16 | 3662 | MACD Cross-Up Signal |
| FTI | TechnipFMC plc | 5/3/2018 | Bullish | 29.8 | 3536 | MACD Cross-Up Signal |
| BG | Bunge Limited | 5/3/2018 | Bullish | 77.99 | 3432 | MACD Cross-Up Signal |
| D | Dominion Energy, Inc. | 5/3/2018 | Bullish | 73.7 | 3392 | MACD +ve Divergence |
| CMS | CMS Energy Corporation | 5/3/2018 | Bullish | 43.29 | 3345 | MACD-H +ve Divergence |
| FAST | Fastenal Company | 5/3/2018 | Bullish | 55.27 | 3146 | MACD Cross-Up Signal |
| INFO | IHS Markit Ltd. | 5/3/2018 | Bullish | 47.41 | 3070 | MACD Cross-Up Signal |
| LEG | Leggett & Platt, Incorporated | 5/3/2018 | Bullish | 43.93 | 3047 | MACD-H +ve Divergence |
| MAS | Masco Corporation | 5/3/2018 | Bullish | 41.16 | 3025 | MACD-H +ve Divergence |
| NKE | Nike, Inc. | 5/3/2018 | Bearish | 65.05 | 8838 | MACD Cross-Down ZeroLine |
| COP | ConocoPhillips | 5/3/2018 | Bearish | 53.99 | 5266 | MACD Cross-Down Signal |
| WY | Weyerhaeuser Company | 5/3/2018 | Bearish | 34.01 | 4985 | MACD Cross-Down Signal |
| BAX | Baxter International Inc. | 5/3/2018 | Bearish | 66.85 | 4768 | MACD Cross-Down Signal |
| ESRX | Express Scripts Holding Company | 5/3/2018 | Bearish | 74.76 | 3699 | MACD Cross-Down Signal |
Have fun!Users must understand what MACD is all about before using the results.
Moses US Stock Scan
AmiBroker Academy.com
Disclaimer:
The above result is for illustration purpose. It is not meant to be used for buy or sell decision. We do not recommend any particular stocks. If particular stocks of such are mentioned, they are meant as demonstration of Amibroker as a powerful charting software and MACD. Amibroker can program to scan the stocks for buy and sell signals.
These are script generated signals. Not all scan results are shown here. The MACD signal should use with price action. Users must understand what MACD and price action are all about before using them. If necessary you should attend a course to learn more on Technical Analysis (TA) and Moving Average Convergence Divergence, MACD.
Once again, the website does not guarantee any results or investment return based on the information and instruction you have read here. It should be used as learning aids only and if you decide to trade real money, all trading decision should be your own.