27 May, 2018
Thank you for visiting the site. Hope you like the content.
Hong Kong Hang Seng Stock Index and Shanghai Stock Index Correlation
We see some correlation with Hong Kong Hang Seng Stock Index and Shanghai Stock Index. See chart, picture worth a thousand words.
Manager your trade risk.
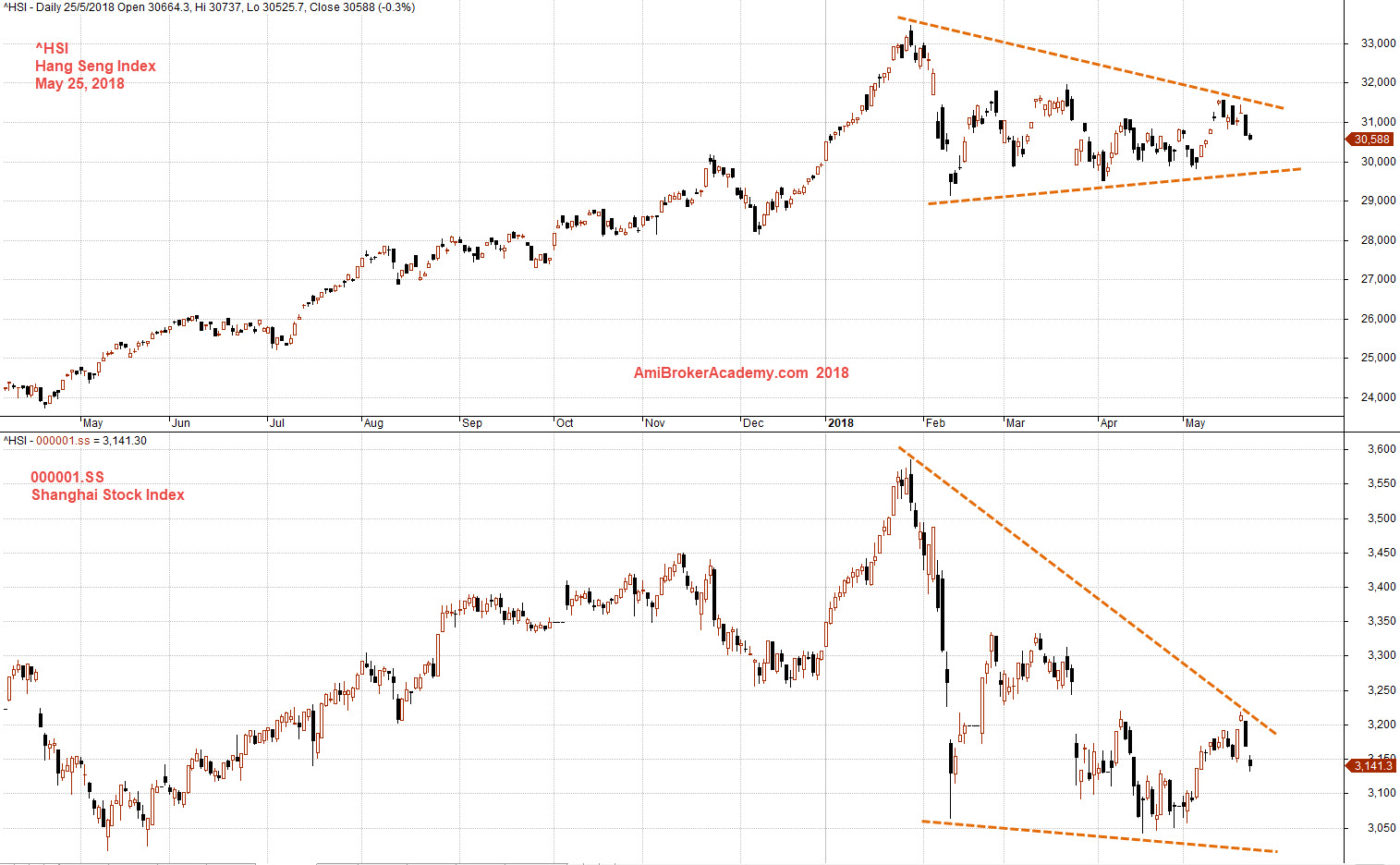
May 25, 2018 Hang Seng Index and Shanghai Stock Index Correlation
Free MACD Scan One-day US Stock MACD Screening Results on May 25 2018
Remember all setup can fail. This is true for all indicators. It is also true for MACD signals setup.
But, even the setup can fail. Without the MACD scan results, how to find a stock might moves in the near eight thousand stocks market. The MACD signals at least reduce the among the stocks you need to study and make your trade plan.
Manage your risk.

May 25, 2018 US Stock One-day MACD Scan Signals
These are the six types of MACD Signals:
- MACD line crosses above MACD signal – Bullish trend
- MACD line crosses above zero line – Bullish trend
- MACD Histogram +ve Divergence – Bullish trend
- MACD line crosses below MACD signal – Bearish trend
- MACD line crosses below zero line – Bearish trend
- MACD Histogram -ve Divergence – Bearish trend
| Ticker | Company | Date | Trend | Close | Vol.(K) | Screening Result |
| INTC | Intel Corporation | 25/5/2018 | Bullish | 55.44 | 18477 | MACD Cross-Up Signal |
| ORCL | Oracle Corporation | 25/5/2018 | Bullish | 47 | 10713 | MACD Cross-Up Signal |
| LUV | Southwest Airlines Company | 25/5/2018 | Bullish | 52.86 | 8678 | MACD Cross-Up Signal |
| TLT | iShares 20+ Year Treasury Bond ETF | 25/5/2018 | Bullish | 119.62 | 8477 | MACD Cross-Up ZeroLine |
| CELG | Celgene Corporation | 25/5/2018 | Bullish | 78.63 | 6011 | MACD Cross-Up Signal |
| LB | L Brands, Inc. | 25/5/2018 | Bullish | 35.5 | 5797 | MACD Cross-Up ZeroLine |
| PEP | Pepsico, Inc. | 25/5/2018 | Bullish | 100.31 | 5323 | MACD Cross-Up ZeroLine |
| MON | Monsanto Company | 25/5/2018 | Bullish | 126.5 | 5018 | MACD Cross-Up Signal |
| EXC | Exelon Corporation | 25/5/2018 | Bullish | 40.67 | 4386 | MACD Cross-Up Signal |
| BMRN | BioMarin Pharmaceutical Inc. | 25/5/2018 | Bullish | 92.49 | 3443 | MACD Cross-Up Signal |
| DHI | D.R. Horton, Inc. | 25/5/2018 | Bullish | 42.66 | 3100 | MACD Cross-Up Signal |
| GPS | Gap, Inc. (The) | 25/5/2018 | Bearish | 28.15 | 24891 | MACD Cross-Down Signal |
| MSFT | Microsoft Corporation | 25/5/2018 | Bearish | 98.36 | 17892 | MACD-H -ve Divergence |
| HAL | Halliburton Company | 25/5/2018 | Bearish | 50.19 | 12594 | MACD Cross-Down ZeroLine |
| NTNX | Nutanix, Inc. | 25/5/2018 | Bearish | 52.5 | 8828 | MACD Cross-Down ZeroLine |
| CVX | Chevron Corporation | 25/5/2018 | Bearish | 122.19 | 8729 | MACD Cross-Down ZeroLine |
| HPQ | HP Inc. | 25/5/2018 | Bearish | 21.91 | 7684 | MACD Cross-Down ZeroLine |
| ADSK | Autodesk, Inc. | 25/5/2018 | Bearish | 132.75 | 6464 | MACD Cross-Down Signal |
| MPC | Marathon Petroleum Corporation | 25/5/2018 | Bearish | 77 | 6261 | MACD Cross-Down Signal |
| PSTG | Pure Storage, Inc. | 25/5/2018 | Bearish | 20.74 | 5425 | MACD Cross-Down ZeroLine |
| USB | U.S. Bancorp | 25/5/2018 | Bearish | 50.54 | 4343 | MACD Cross-Down ZeroLine |
| HST | Host Hotels & Resorts, Inc. | 25/5/2018 | Bearish | 21.56 | 4212 | MACD-H -ve Divergence |
| HIBB | Hibbett Sports, Inc. | 25/5/2018 | Bearish | 24.43 | 4029 | MACD Cross-Down Signal |
| FCAU | Fiat Chrysler Automobiles N.V. | 25/5/2018 | Bearish | 21.82 | 3870 | MACD Cross-Down Signal |
| NOV | National Oilwell Varco, Inc. | 25/5/2018 | Bearish | 41.26 | 3790 | MACD Cross-Down Signal |
| FTI | TechnipFMC plc | 25/5/2018 | Bearish | 31.23 | 3702 | MACD Cross-Down ZeroLine |
| CCL | Carnival Corporation | 25/5/2018 | Bearish | 64.25 | 3588 | MACD Cross-Down Signal |
| VLO | Valero Energy Corporation | 25/5/2018 | Bearish | 118.73 | 3540 | MACD Cross-Down Signal |
| NBL | Noble Energy Inc. | 25/5/2018 | Bearish | 35.34 | 3357 | MACD Cross-Down Signal |
Moses US Stock ScanYou must understand what MACD is all about before using the results.
AmiBroker Academy.com
Disclaimer:
The above result is for illustration purpose. It is not meant to be used for buy or sell decision. We do not recommend any particular stocks. If particular stocks of such are mentioned, they are meant as demonstration of Amibroker as a powerful charting software and MACD. Amibroker can program to scan the stocks for buy and sell signals.
These are script generated signals. Not all scan results are shown here. The MACD signal should use with price action. Users must understand what MACD and price action are all about before using them. If necessary you should attend a course to learn more on Technical Analysis (TA) and Moving Average Convergence Divergence, MACD.
Once again, the website does not guarantee any results or investment return based on the information and instruction you have read here. It should be used as learning aids only and if you decide to trade real money, all trading decision should be your own.