19 May, 2018
Thank you for visiting the site. Hope you like the content.
Xinhua-Media 皖新传媒 and MACD
See chart, picture worth a thousand words. MACD is a leading indicator for trend change. Study Xinhua-Media 皖新传媒 stock price.
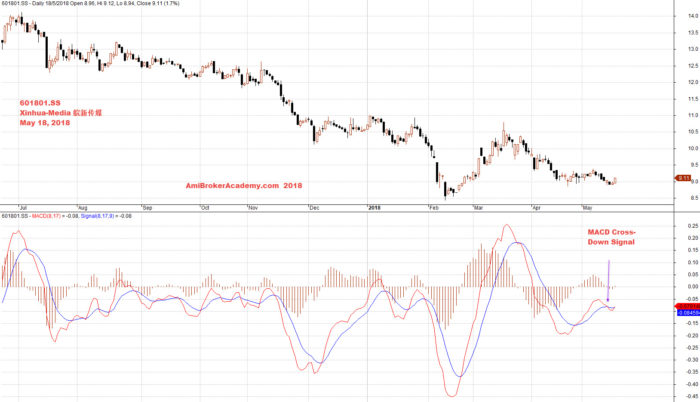
May 18, 2018 Xinhua-Media 皖新传媒 and MACD
Free MACD Scan One-day US Stock MACD Screening Results on May 17 2018
Remember all setup can fail. This is true for all indicators. It is also true for MACD signals setup. See some of the MACD setup fail examples on this website.
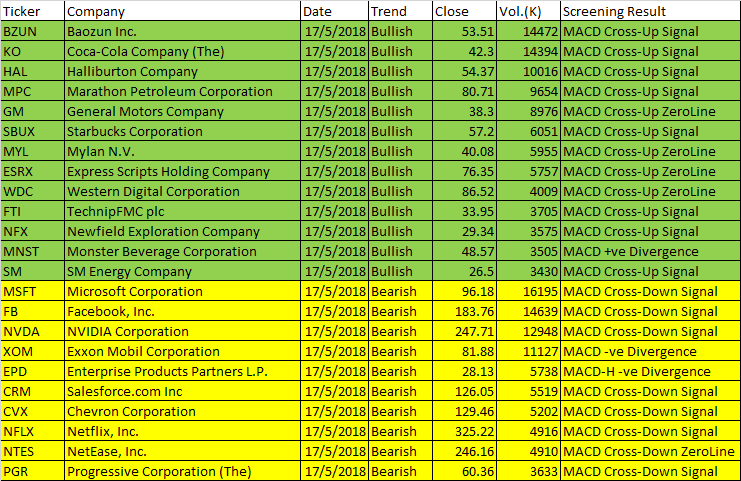
May 17, 2018 US Stock One-day MACD Signals
These are the six types of MACD Signals:
- MACD line crosses above MACD signal – Bullish trend
- MACD line crosses above zero line – Bullish trend
- MACD Histogram +ve Divergence – Bullish trend
- MACD line crosses below MACD signal – Bearish trend
- MACD line crosses below zero line – Bearish trend
- MACD Histogram -ve Divergence – Bearish trend
| Ticker | Company | Date | Trend | Close | Vol.(K) | Screening Result |
| BZUN | Baozun Inc. | 17/5/2018 | Bullish | 53.51 | 14472 | MACD Cross-Up Signal |
| KO | Coca-Cola Company (The) | 17/5/2018 | Bullish | 42.3 | 14394 | MACD Cross-Up Signal |
| HAL | Halliburton Company | 17/5/2018 | Bullish | 54.37 | 10016 | MACD Cross-Up Signal |
| MPC | Marathon Petroleum Corporation | 17/5/2018 | Bullish | 80.71 | 9654 | MACD Cross-Up Signal |
| GM | General Motors Company | 17/5/2018 | Bullish | 38.3 | 8976 | MACD Cross-Up ZeroLine |
| SBUX | Starbucks Corporation | 17/5/2018 | Bullish | 57.2 | 6051 | MACD Cross-Up Signal |
| MYL | Mylan N.V. | 17/5/2018 | Bullish | 40.08 | 5955 | MACD Cross-Up ZeroLine |
| ESRX | Express Scripts Holding Company | 17/5/2018 | Bullish | 76.35 | 5757 | MACD Cross-Up ZeroLine |
| WDC | Western Digital Corporation | 17/5/2018 | Bullish | 86.52 | 4009 | MACD Cross-Up ZeroLine |
| FTI | TechnipFMC plc | 17/5/2018 | Bullish | 33.95 | 3705 | MACD Cross-Up Signal |
| NFX | Newfield Exploration Company | 17/5/2018 | Bullish | 29.34 | 3575 | MACD Cross-Up Signal |
| MNST | Monster Beverage Corporation | 17/5/2018 | Bullish | 48.57 | 3505 | MACD +ve Divergence |
| SM | SM Energy Company | 17/5/2018 | Bullish | 26.5 | 3430 | MACD Cross-Up Signal |
| MSFT | Microsoft Corporation | 17/5/2018 | Bearish | 96.18 | 16195 | MACD Cross-Down Signal |
| FB | Facebook, Inc. | 17/5/2018 | Bearish | 183.76 | 14639 | MACD Cross-Down Signal |
| NVDA | NVIDIA Corporation | 17/5/2018 | Bearish | 247.71 | 12948 | MACD Cross-Down Signal |
| XOM | Exxon Mobil Corporation | 17/5/2018 | Bearish | 81.88 | 11127 | MACD -ve Divergence |
| EPD | Enterprise Products Partners L.P. | 17/5/2018 | Bearish | 28.13 | 5738 | MACD-H -ve Divergence |
| CRM | Salesforce.com Inc | 17/5/2018 | Bearish | 126.05 | 5519 | MACD Cross-Down Signal |
| CVX | Chevron Corporation | 17/5/2018 | Bearish | 129.46 | 5202 | MACD Cross-Down Signal |
| NFLX | Netflix, Inc. | 17/5/2018 | Bearish | 325.22 | 4916 | MACD Cross-Down Signal |
| NTES | NetEase, Inc. | 17/5/2018 | Bearish | 246.16 | 4910 | MACD Cross-Down ZeroLine |
| PGR | Progressive Corporation (The) | 17/5/2018 | Bearish | 60.36 | 3633 | MACD Cross-Down Signal |
You must understand what MACD is all about before using the results.
Moses US Stock Scan
AmiBroker Academy.com
Disclaimer:
The above result is for illustration purpose. It is not meant to be used for buy or sell decision. We do not recommend any particular stocks. If particular stocks of such are mentioned, they are meant as demonstration of Amibroker as a powerful charting software and MACD. Amibroker can program to scan the stocks for buy and sell signals.
These are script generated signals. Not all scan results are shown here. The MACD signal should use with price action. Users must understand what MACD and price action are all about before using them. If necessary you should attend a course to learn more on Technical Analysis (TA) and Moving Average Convergence Divergence, MACD.
Once again, the website does not guarantee any results or investment return based on the information and instruction you have read here. It should be used as learning aids only and if you decide to trade real money, all trading decision should be your own.