June 13, 2018
Thank you for visiting the site. Hope you like the content.
600118.SS 中国卫星 China Spaceesat Company and MACD Divergence
Study S&P 500 using Moving Average, instead of using one we use high, low and close. We use 34 period moving. See chart, picture worth a thousand words, manage your risk.
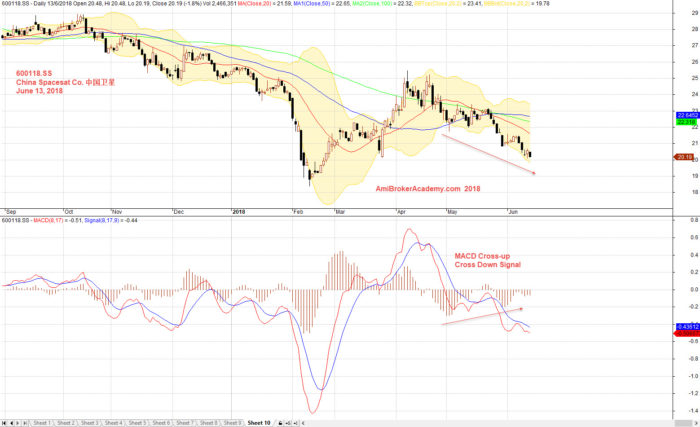
June 13, 2018 中国卫星 China Spaceesat Company and MACD Divergence
Free MACD Scan One-day US Stock MACD Screening Results on June 12 2018
Remember all setup can fail. This is true for all indicators. It is also true for MACD signals setup.
But, even the setup can fail. Without the MACD scan results, how to find a stock might moves in the near eight thousand stocks market. The MACD signals at least reduce the among the stocks you need to study and make your trade plan.
Manage your risk.
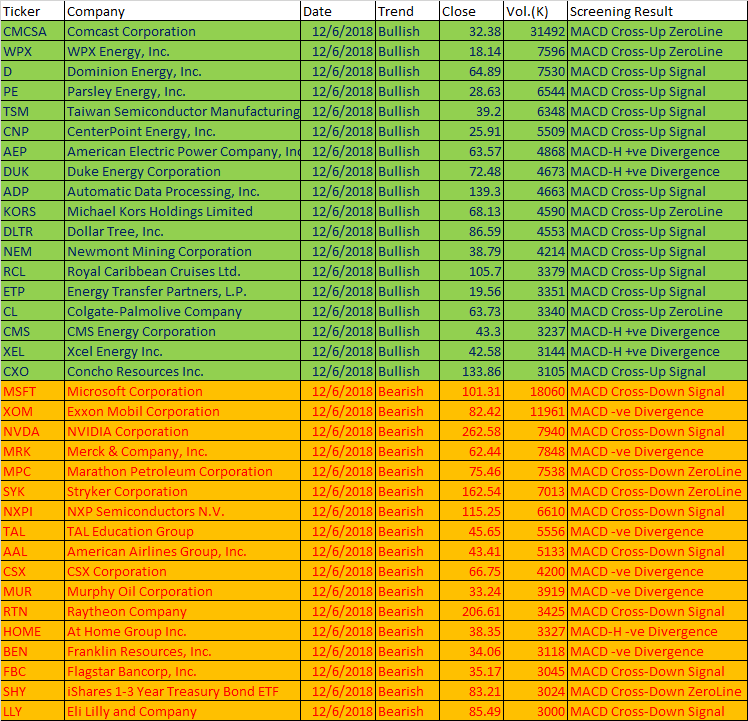
June 12 2018 US Stock One-day MACD Scan Signals
These are the six types of MACD Signals:
- MACD line crosses above MACD signal – Bullish trend
- MACD line crosses above zero line – Bullish trend
- MACD Histogram +ve Divergence – Bullish trend
- MACD line crosses below MACD signal – Bearish trend
- MACD line crosses below zero line – Bearish trend
- MACD Histogram -ve Divergence – Bearish trend
| Ticker | Company | Date | Trend | Close | Vol.(K) | Screening Result |
| CMCSA | Comcast Corporation | 12/6/2018 | Bullish | 32.38 | 31492 | MACD Cross-Up ZeroLine |
| WPX | WPX Energy, Inc. | 12/6/2018 | Bullish | 18.14 | 7596 | MACD Cross-Up ZeroLine |
| D | Dominion Energy, Inc. | 12/6/2018 | Bullish | 64.89 | 7530 | MACD Cross-Up Signal |
| PE | Parsley Energy, Inc. | 12/6/2018 | Bullish | 28.63 | 6544 | MACD Cross-Up Signal |
| TSM | Taiwan Semiconductor Manufacturing Company Ltd. | 12/6/2018 | Bullish | 39.2 | 6348 | MACD Cross-Up Signal |
| CNP | CenterPoint Energy, Inc. | 12/6/2018 | Bullish | 25.91 | 5509 | MACD Cross-Up Signal |
| AEP | American Electric Power Company, Inc. | 12/6/2018 | Bullish | 63.57 | 4868 | MACD-H +ve Divergence |
| DUK | Duke Energy Corporation | 12/6/2018 | Bullish | 72.48 | 4673 | MACD-H +ve Divergence |
| ADP | Automatic Data Processing, Inc. | 12/6/2018 | Bullish | 139.3 | 4663 | MACD Cross-Up Signal |
| KORS | Michael Kors Holdings Limited | 12/6/2018 | Bullish | 68.13 | 4590 | MACD Cross-Up ZeroLine |
| DLTR | Dollar Tree, Inc. | 12/6/2018 | Bullish | 86.59 | 4553 | MACD Cross-Up Signal |
| NEM | Newmont Mining Corporation | 12/6/2018 | Bullish | 38.79 | 4214 | MACD Cross-Up Signal |
| RCL | Royal Caribbean Cruises Ltd. | 12/6/2018 | Bullish | 105.7 | 3379 | MACD Cross-Up Signal |
| ETP | Energy Transfer Partners, L.P. | 12/6/2018 | Bullish | 19.56 | 3351 | MACD Cross-Up Signal |
| CL | Colgate-Palmolive Company | 12/6/2018 | Bullish | 63.73 | 3340 | MACD Cross-Up ZeroLine |
| CMS | CMS Energy Corporation | 12/6/2018 | Bullish | 43.3 | 3237 | MACD-H +ve Divergence |
| XEL | Xcel Energy Inc. | 12/6/2018 | Bullish | 42.58 | 3144 | MACD-H +ve Divergence |
| CXO | Concho Resources Inc. | 12/6/2018 | Bullish | 133.86 | 3105 | MACD Cross-Up Signal |
| MSFT | Microsoft Corporation | 12/6/2018 | Bearish | 101.31 | 18060 | MACD Cross-Down Signal |
| XOM | Exxon Mobil Corporation | 12/6/2018 | Bearish | 82.42 | 11961 | MACD -ve Divergence |
| NVDA | NVIDIA Corporation | 12/6/2018 | Bearish | 262.58 | 7940 | MACD Cross-Down Signal |
| MRK | Merck & Company, Inc. | 12/6/2018 | Bearish | 62.44 | 7848 | MACD -ve Divergence |
| MPC | Marathon Petroleum Corporation | 12/6/2018 | Bearish | 75.46 | 7538 | MACD Cross-Down ZeroLine |
| SYK | Stryker Corporation | 12/6/2018 | Bearish | 162.54 | 7013 | MACD Cross-Down ZeroLine |
| NXPI | NXP Semiconductors N.V. | 12/6/2018 | Bearish | 115.25 | 6610 | MACD Cross-Down Signal |
| TAL | TAL Education Group | 12/6/2018 | Bearish | 45.65 | 5556 | MACD -ve Divergence |
| AAL | American Airlines Group, Inc. | 12/6/2018 | Bearish | 43.41 | 5133 | MACD Cross-Down Signal |
| CSX | CSX Corporation | 12/6/2018 | Bearish | 66.75 | 4200 | MACD -ve Divergence |
| MUR | Murphy Oil Corporation | 12/6/2018 | Bearish | 33.24 | 3919 | MACD -ve Divergence |
| RTN | Raytheon Company | 12/6/2018 | Bearish | 206.61 | 3425 | MACD Cross-Down Signal |
| HOME | At Home Group Inc. | 12/6/2018 | Bearish | 38.35 | 3327 | MACD-H -ve Divergence |
| BEN | Franklin Resources, Inc. | 12/6/2018 | Bearish | 34.06 | 3118 | MACD -ve Divergence |
| FBC | Flagstar Bancorp, Inc. | 12/6/2018 | Bearish | 35.17 | 3045 | MACD Cross-Down Signal |
| SHY | iShares 1-3 Year Treasury Bond ETF | 12/6/2018 | Bearish | 83.21 | 3024 | MACD Cross-Down ZeroLine |
| LLY | Eli Lilly and Company | 12/6/2018 | Bearish | 85.49 | 3000 | MACD Cross-Down Signal
|
You must understand what MACD is all about before using the results.
Moses US Stock Scan
AmiBroker Academy.com
Disclaimer:
The above result is for illustration purpose. It is not meant to be used for buy or sell decision. We do not recommend any particular stocks. If particular stocks of such are mentioned, they are meant as demonstration of Amibroker as a powerful charting software and MACD. Amibroker can program to scan the stocks for buy and sell signals.
These are script generated signals. Not all scan results are shown here. The MACD signal should use with price action. Users must understand what MACD and price action are all about before using them. If necessary you should attend a course to learn more on Technical Analysis (TA) and Moving Average Convergence Divergence, MACD.
Once again, the website does not guarantee any results or investment return based on the information and instruction you have read here. It should be used as learning aids only and if you decide to trade real money, all trading decision should be your own.