June 10, 2018
Thank you for visiting the site. Hope you like the content.
^GSPC S&P 500 and MA Wave
Study S&P 500 using Moving Average, instead of using one we use high, low and close. We use 34 period moving. See chart, picture worth a thousand words, manage your risk.
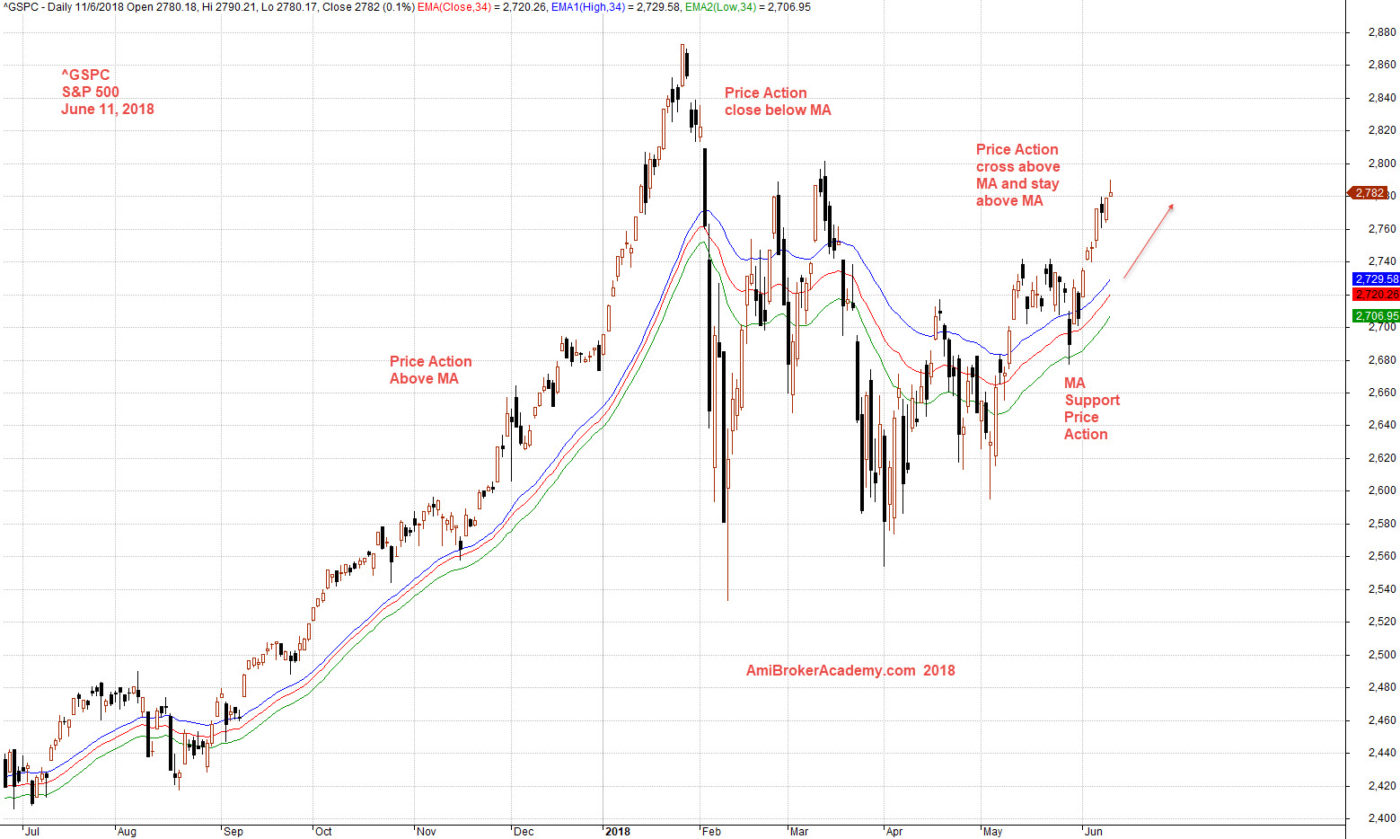
June 11, 2018 S&P 500 and MA Wave
^GSPC S&P 500 and MACD
Study S&P 500 using Moving Average Convergence Divergence, MACD. See chart, picture worth a thousand words, manage your risk.
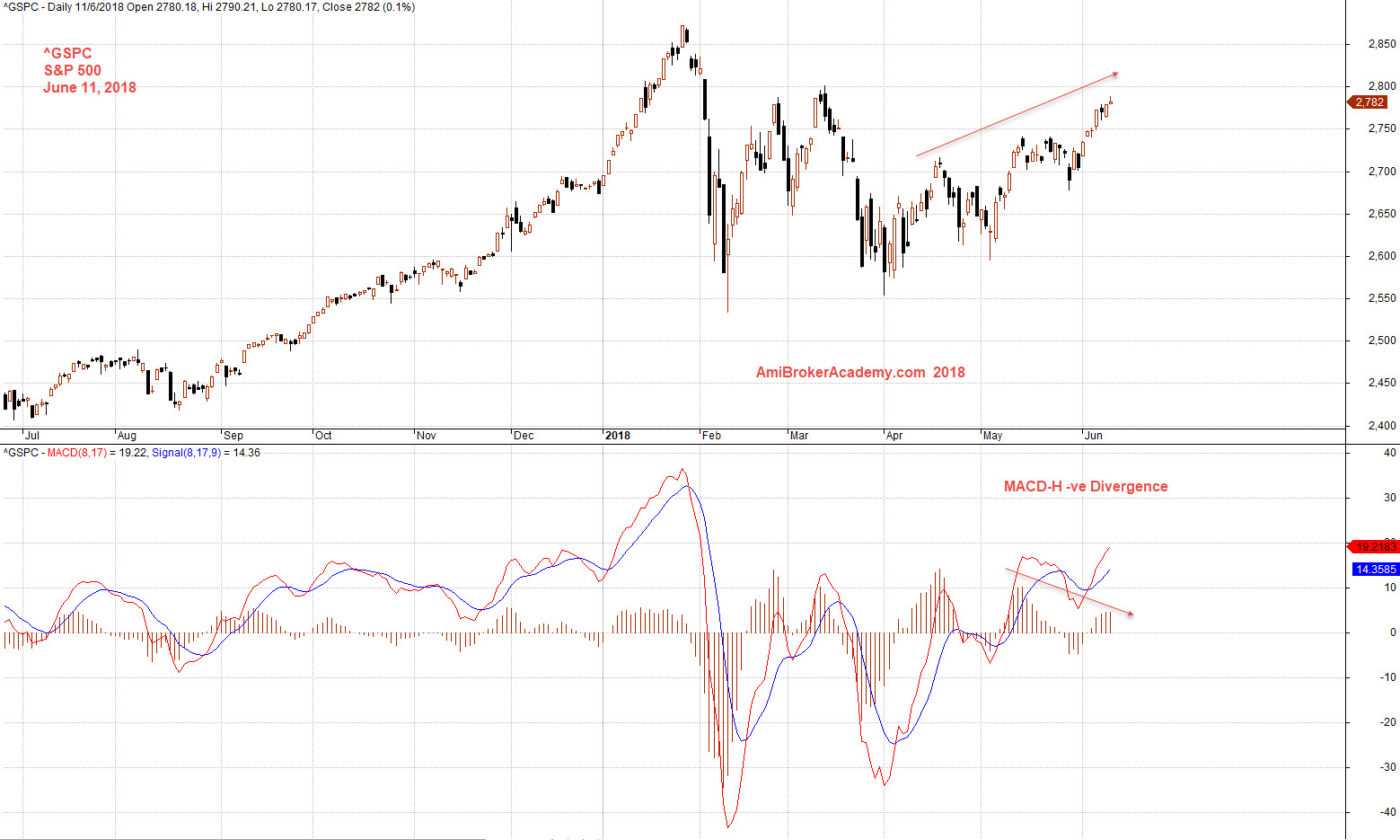
June 11, 2018 S&P 500 and MACD Divergence
Free MACD Scan One-day US Stock MACD Screening Results on June 11 2018
Remember all setup can fail. This is true for all indicators. It is also true for MACD signals setup.
But, even the setup can fail. Without the MACD scan results, how to find a stock might moves in the near eight thousand stocks market. The MACD signals at least reduce the among the stocks you need to study and make your trade plan.
Manage your risk.
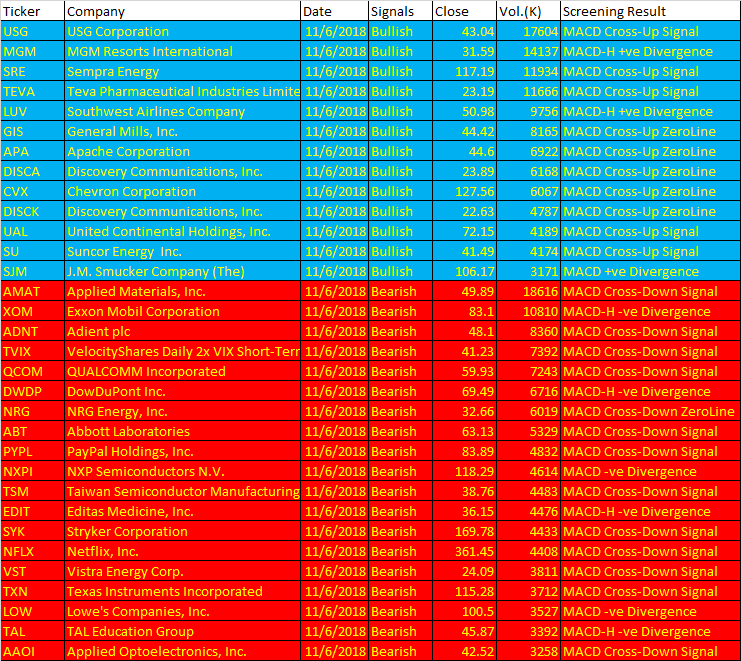
June 11, 2018 US Stock One-day MACD Signal
These are the six types of MACD Signals:
- MACD line crosses above MACD signal – Bullish trend
- MACD line crosses above zero line – Bullish trend
- MACD Histogram +ve Divergence – Bullish trend
- MACD line crosses below MACD signal – Bearish trend
- MACD line crosses below zero line – Bearish trend
- MACD Histogram -ve Divergence – Bearish trend
| Ticker | Company | Date | Signals | Close | Vol.(K) | Screening Result |
| USG | USG Corporation | 11/6/2018 | Bullish | 43.04 | 17604 | MACD Cross-Up Signal |
| MGM | MGM Resorts International | 11/6/2018 | Bullish | 31.59 | 14137 | MACD-H +ve Divergence |
| SRE | Sempra Energy | 11/6/2018 | Bullish | 117.19 | 11934 | MACD Cross-Up Signal |
| TEVA | Teva Pharmaceutical Industries Limited | 11/6/2018 | Bullish | 23.19 | 11666 | MACD Cross-Up Signal |
| LUV | Southwest Airlines Company | 11/6/2018 | Bullish | 50.98 | 9756 | MACD-H +ve Divergence |
| GIS | General Mills, Inc. | 11/6/2018 | Bullish | 44.42 | 8165 | MACD Cross-Up ZeroLine |
| APA | Apache Corporation | 11/6/2018 | Bullish | 44.6 | 6922 | MACD Cross-Up ZeroLine |
| DISCA | Discovery Communications, Inc. | 11/6/2018 | Bullish | 23.89 | 6168 | MACD Cross-Up ZeroLine |
| CVX | Chevron Corporation | 11/6/2018 | Bullish | 127.56 | 6067 | MACD Cross-Up ZeroLine |
| DISCK | Discovery Communications, Inc. | 11/6/2018 | Bullish | 22.63 | 4787 | MACD Cross-Up ZeroLine |
| UAL | United Continental Holdings, Inc. | 11/6/2018 | Bullish | 72.15 | 4189 | MACD Cross-Up Signal |
| SU | Suncor Energy Inc. | 11/6/2018 | Bullish | 41.49 | 4174 | MACD Cross-Up Signal |
| SJM | J.M. Smucker Company (The) | 11/6/2018 | Bullish | 106.17 | 3171 | MACD +ve Divergence |
| AMAT | Applied Materials, Inc. | 11/6/2018 | Bearish | 49.89 | 18616 | MACD Cross-Down Signal |
| XOM | Exxon Mobil Corporation | 11/6/2018 | Bearish | 83.1 | 10810 | MACD-H -ve Divergence |
| ADNT | Adient plc | 11/6/2018 | Bearish | 48.1 | 8360 | MACD Cross-Down Signal |
| TVIX | VelocityShares Daily 2x VIX Short-Term ETN | 11/6/2018 | Bearish | 41.23 | 7392 | MACD Cross-Down Signal |
| QCOM | QUALCOMM Incorporated | 11/6/2018 | Bearish | 59.93 | 7243 | MACD Cross-Down Signal |
| DWDP | DowDuPont Inc. | 11/6/2018 | Bearish | 69.49 | 6716 | MACD-H -ve Divergence |
| NRG | NRG Energy, Inc. | 11/6/2018 | Bearish | 32.66 | 6019 | MACD Cross-Down ZeroLine |
| ABT | Abbott Laboratories | 11/6/2018 | Bearish | 63.13 | 5329 | MACD Cross-Down Signal |
| PYPL | PayPal Holdings, Inc. | 11/6/2018 | Bearish | 83.89 | 4832 | MACD Cross-Down Signal |
| NXPI | NXP Semiconductors N.V. | 11/6/2018 | Bearish | 118.29 | 4614 | MACD -ve Divergence |
| TSM | Taiwan Semiconductor Manufacturing Company Ltd. | 11/6/2018 | Bearish | 38.76 | 4483 | MACD Cross-Down Signal |
| EDIT | Editas Medicine, Inc. | 11/6/2018 | Bearish | 36.15 | 4476 | MACD-H -ve Divergence |
| SYK | Stryker Corporation | 11/6/2018 | Bearish | 169.78 | 4433 | MACD Cross-Down Signal |
| NFLX | Netflix, Inc. | 11/6/2018 | Bearish | 361.45 | 4408 | MACD Cross-Down Signal |
| VST | Vistra Energy Corp. | 11/6/2018 | Bearish | 24.09 | 3811 | MACD Cross-Down Signal |
| TXN | Texas Instruments Incorporated | 11/6/2018 | Bearish | 115.28 | 3712 | MACD Cross-Down Signal |
| LOW | Lowe’s Companies, Inc. | 11/6/2018 | Bearish | 100.5 | 3527 | MACD -ve Divergence |
| TAL | TAL Education Group | 11/6/2018 | Bearish | 45.87 | 3392 | MACD-H -ve Divergence |
| AAOI | Applied Optoelectronics, Inc. | 11/6/2018 | Bearish | 42.52 | 3258 | MACD Cross-Down Signal |
You must understand what MACD is all about before using the results.
Moses US Stock Scan
AmiBroker Academy.com
Disclaimer:
The above result is for illustration purpose. It is not meant to be used for buy or sell decision. We do not recommend any particular stocks. If particular stocks of such are mentioned, they are meant as demonstration of Amibroker as a powerful charting software and MACD. Amibroker can program to scan the stocks for buy and sell signals.
These are script generated signals. Not all scan results are shown here. The MACD signal should use with price action. Users must understand what MACD and price action are all about before using them. If necessary you should attend a course to learn more on Technical Analysis (TA) and Moving Average Convergence Divergence, MACD.
Once again, the website does not guarantee any results or investment return based on the information and instruction you have read here. It should be used as learning aids only and if you decide to trade real money, all trading decision should be your own.