April 24, 2018
Thanks for visiting the site, AmiBrokerAcademy.com.
US Stock Analysis
BKOF BOK Financial Corporation and Fibonacci
Study BOK Financial using Fibonacci. Swing low to high, draw Fibonacci Extension. The stock breakout 127%, and approaching 161%, but fail to reach. The stock price get supported by 127% and reapproach 161% again. Be careful, manage your risk.
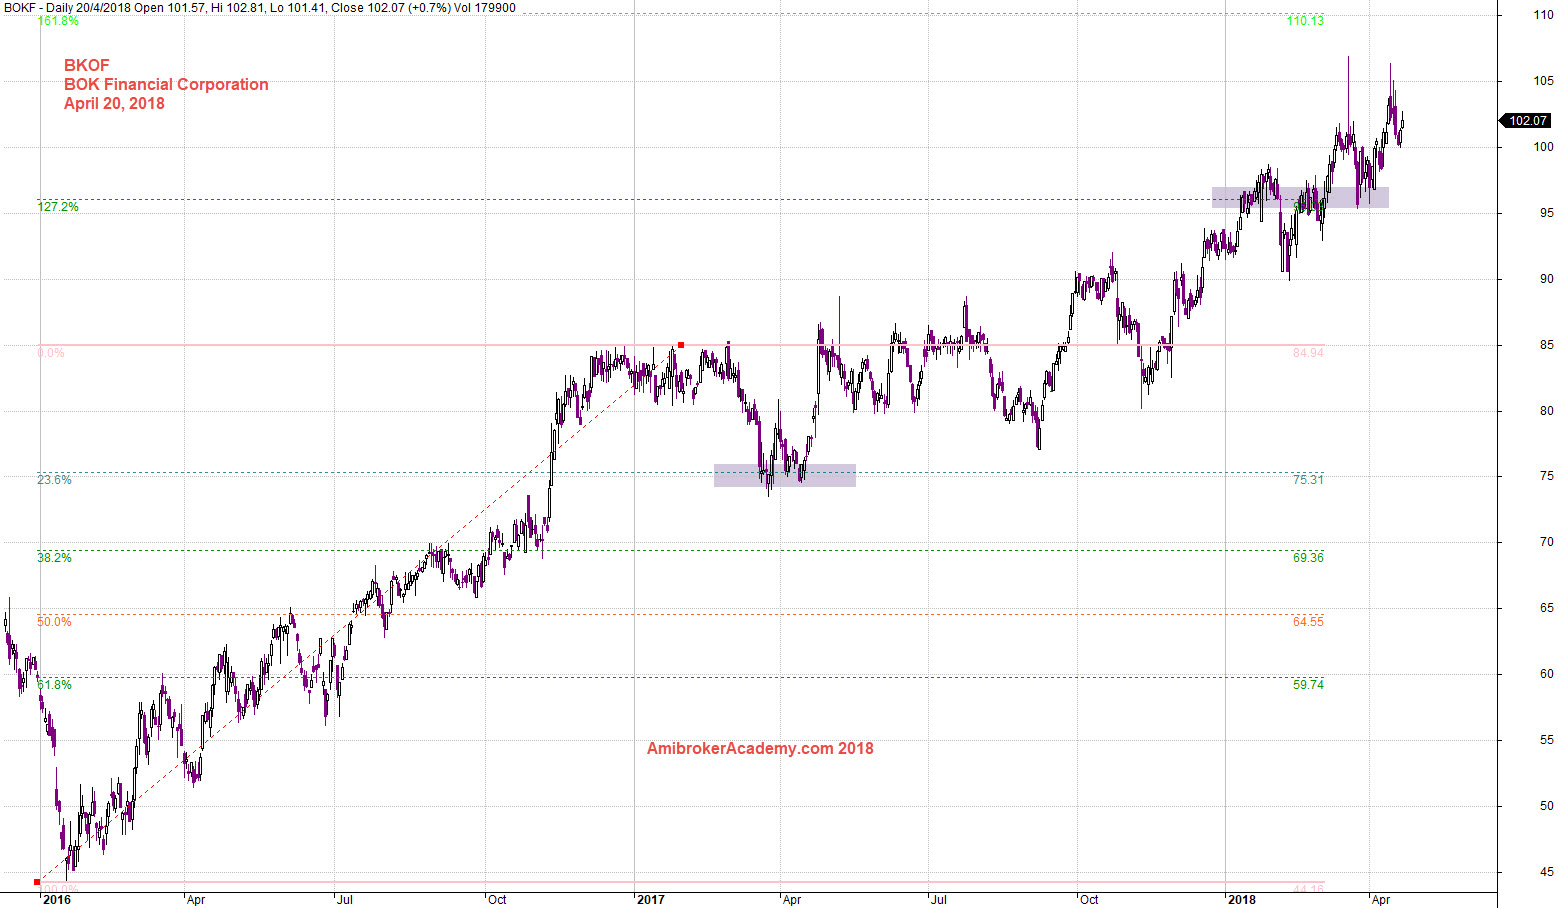
April 20, 2018 BOK Financial Corporation and Fibo Extension Low to High
BKOF BOK Financial Corporation and MA Wave
Study the stock using Moving Average, add three MA, high, low and close, forms a band, you can call it river, wave or band. This gives additional visual effect, see chart for more. The MA wave is point between one to two o’clock. Bullish, very bullish. Manage your risk.
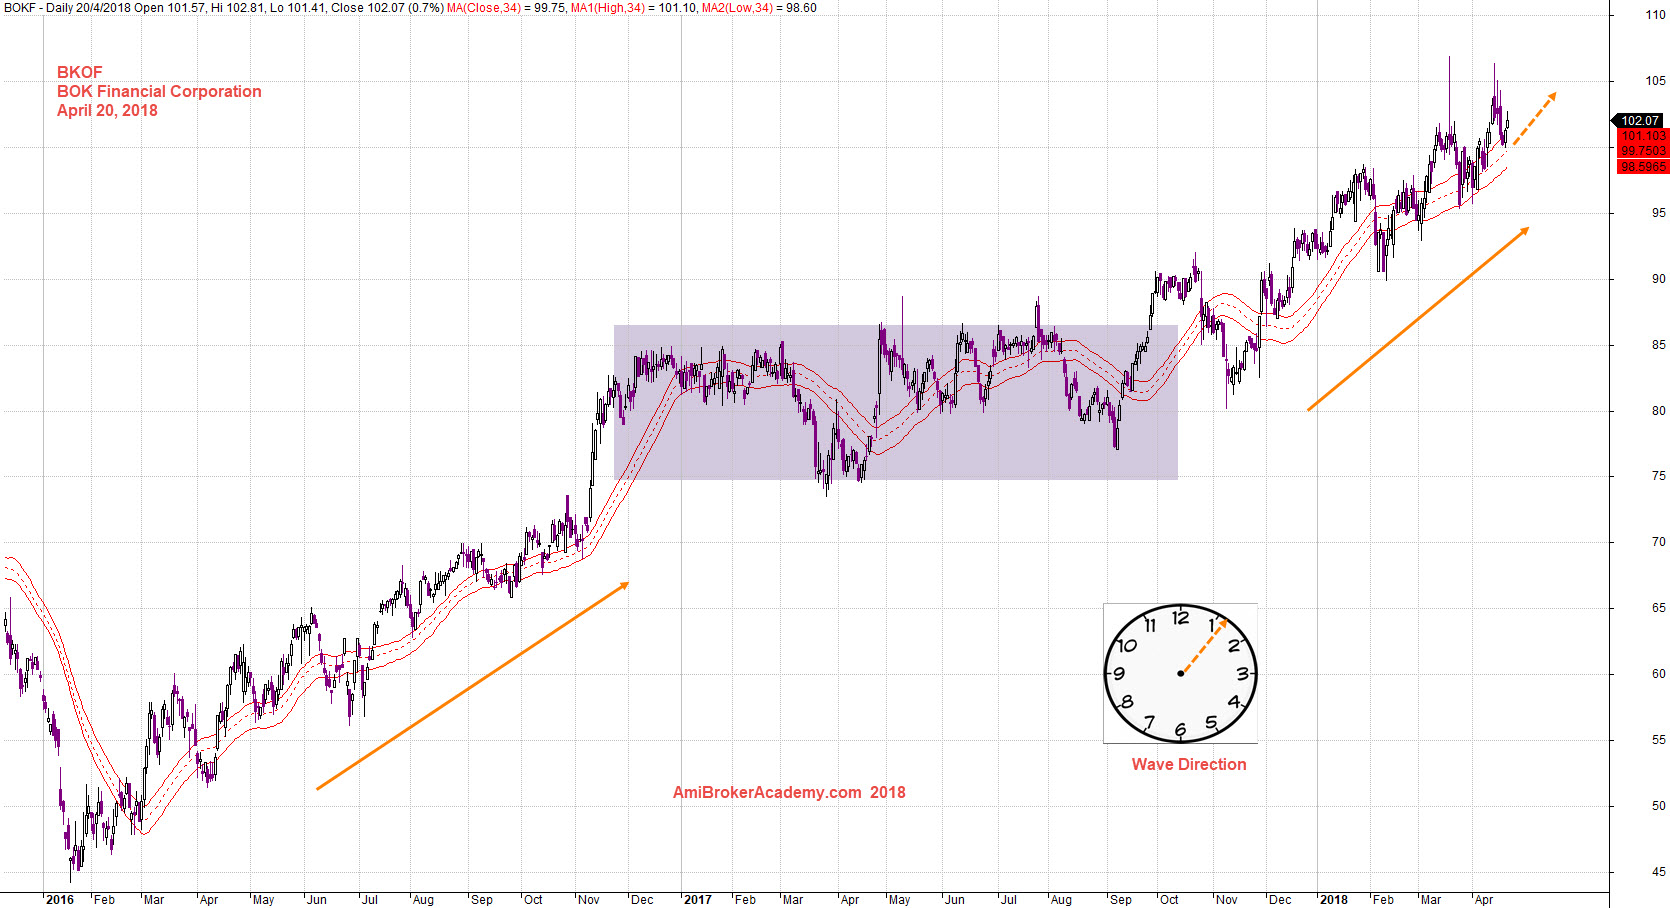
April 20, 2018 BOK Financial Corporation and MA Wave Direction
Moses Stock Analysis
AmiBrokerAcademy.com
Disclaimer: All information, data and material contained, presented, or provided on amibrokeracademy.com is for educational purposes only. It is not to be construed or intended as providing trading or legal advice. Decisions you make about your trading or investment are important to you and your family, therefore should be made in consultation with a competent financial advisor or professional. We are not financial advisor and do not claim to be. Any views expressed here-in are not necessarily those held by amibrokeracademy.com. You are responsible for your trade decision and wealth being.