March 1, 2015
The last time we look at Facebook Inc was nearly a month ago. We see many geometry pattern AB = CD. Besides that PA was testing 100 MA. We saw the PA was bearish bias. Now what have you see? Price has broken the trendline, 20 MA has broken up 50 MA. We see 20, 50 and 100 MA have started to slop up and wide open. The price has crossed up 20, 50 and 100 MA, now the price action has turned bullish bias.
See chart for more details. You may see something I missed. Chart worth a thousand words.
I believe you are just like me enjoy reading other analysis. However, it is good to do yours. It is good to have your analysis different from others.
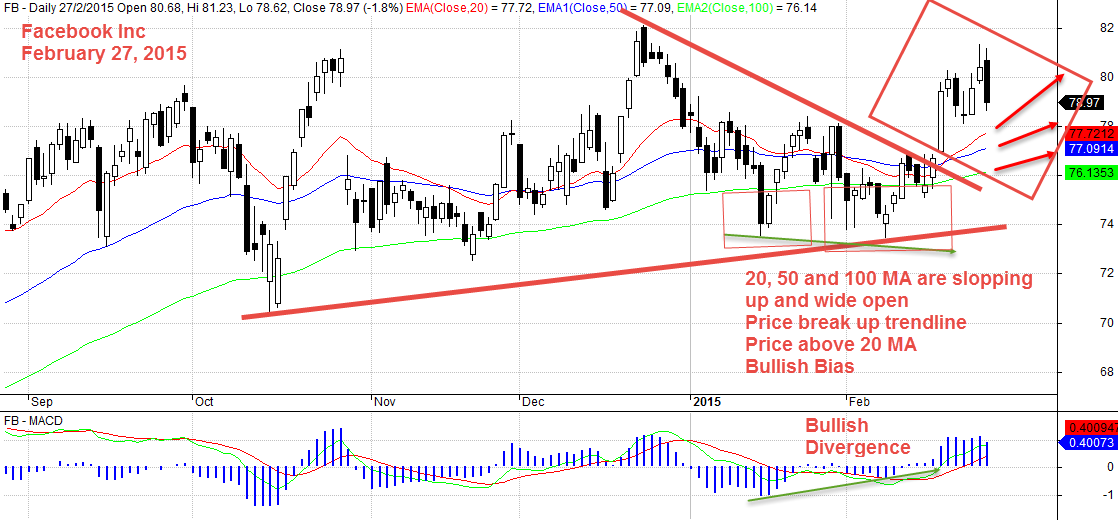
Facebook Inc, February 27, 2015
Thanks for visiting this extra ordinary site, AmiBrokerAcademy.com.
Watch this space here, some great stock will be analyse here. See you more.
Moses
DISCLAIMER
Stock trading is not a get rich quick scheme and it is high risk.
Information provided here is of the nature of a general comment only and no intend to be specific for trading advice. It has prepared without regard to any particular investment objectives, financial situation or needs. Information should NOT be considered as an offer or enticement to buy, sell or trade.
You should seek advice from your broker, or licensed investment advisor, before taking any action.
Once again, the website does not guarantee any results or investment return based on the information and instruction you have read here. It should be used as learning aids.
Trading is personal. You are responsible for your own trading decision.
The comment is the author personal experience. There is no intent for your believe and follow.