August 16, 2017
A Trading Goal is the Stock Price Moves
Many active traders, one common goal is to trade a trending stock.
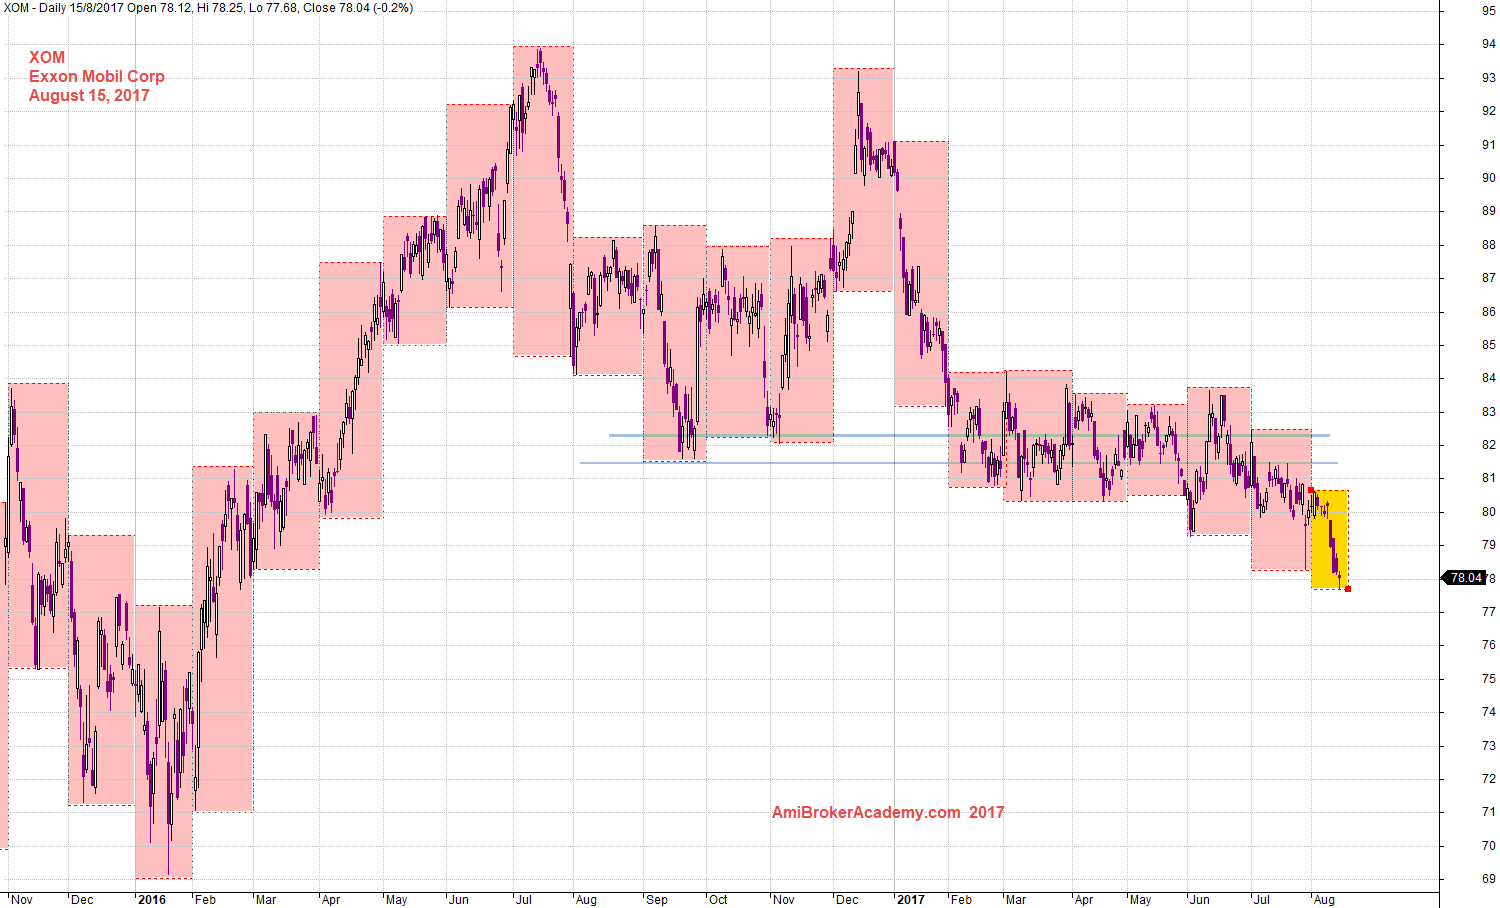
Taking a look at the chart, you’ll notice that, unlike other stock the share the price was up, and down and now sideways. The share price is break below the key horizonatal trendline, neckline. The sideways price action near the resistance level over the past several months in 2017 and now start to move south suggests that the bears are in control of the momentum.
Based on the chart, the bulls may want to remain in the sidelines until there is a signal of a major shift in fundamentals or wait for the price to make several closes above $82.
Exxon Mobil Corporation and Support Resistance
See chart for more, picture worth a thousand words.
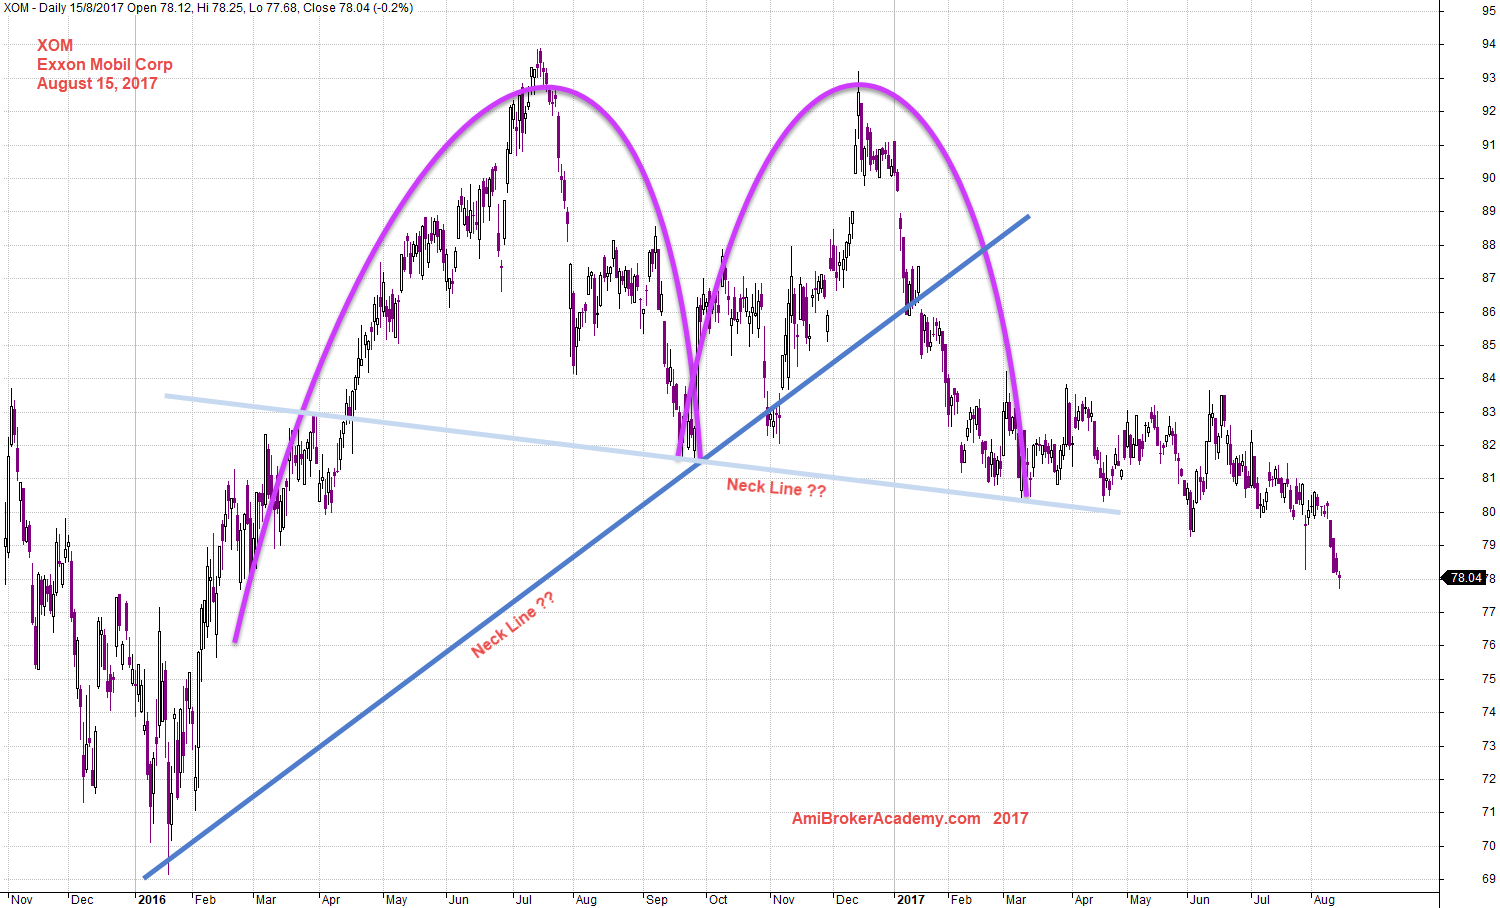
Do you notice that the same high tested twice; double top? If the top tested twice, it would mean the share price is bearish. Where is the price action? The price action has broke out below neckline, $82 region if you draw a horizontal neckline.
A horizontal neckline is a form a support resistance, if so the price action is now resisted by resistance. The share price is now under water, take resistance as a the surface level.
August 15, 2017 Exxon Mobil Corporation and Support Resistance
Two More Ways to See The Double Top Exxon Mobil Corporation XOM
Picture worth a thousand words, the chart shows you two more ways to see the double top, when you vary the neckline. In addition to the horizontal neckline, the following is how you trade the double top. Have fun! Enjoy learning.
August 15, 2017 Exxon Mobil Corp and Double Top
What MACD Tells You – Exxon Mobil Corporation XOM
Picture worth a thousand words, the chart share prices keep moving lower, very slow. But the MACD is continued to close to zeroline. The last part the MACD crosses below, and moves further from zeroline.
It is hard to break above $82. Will see.
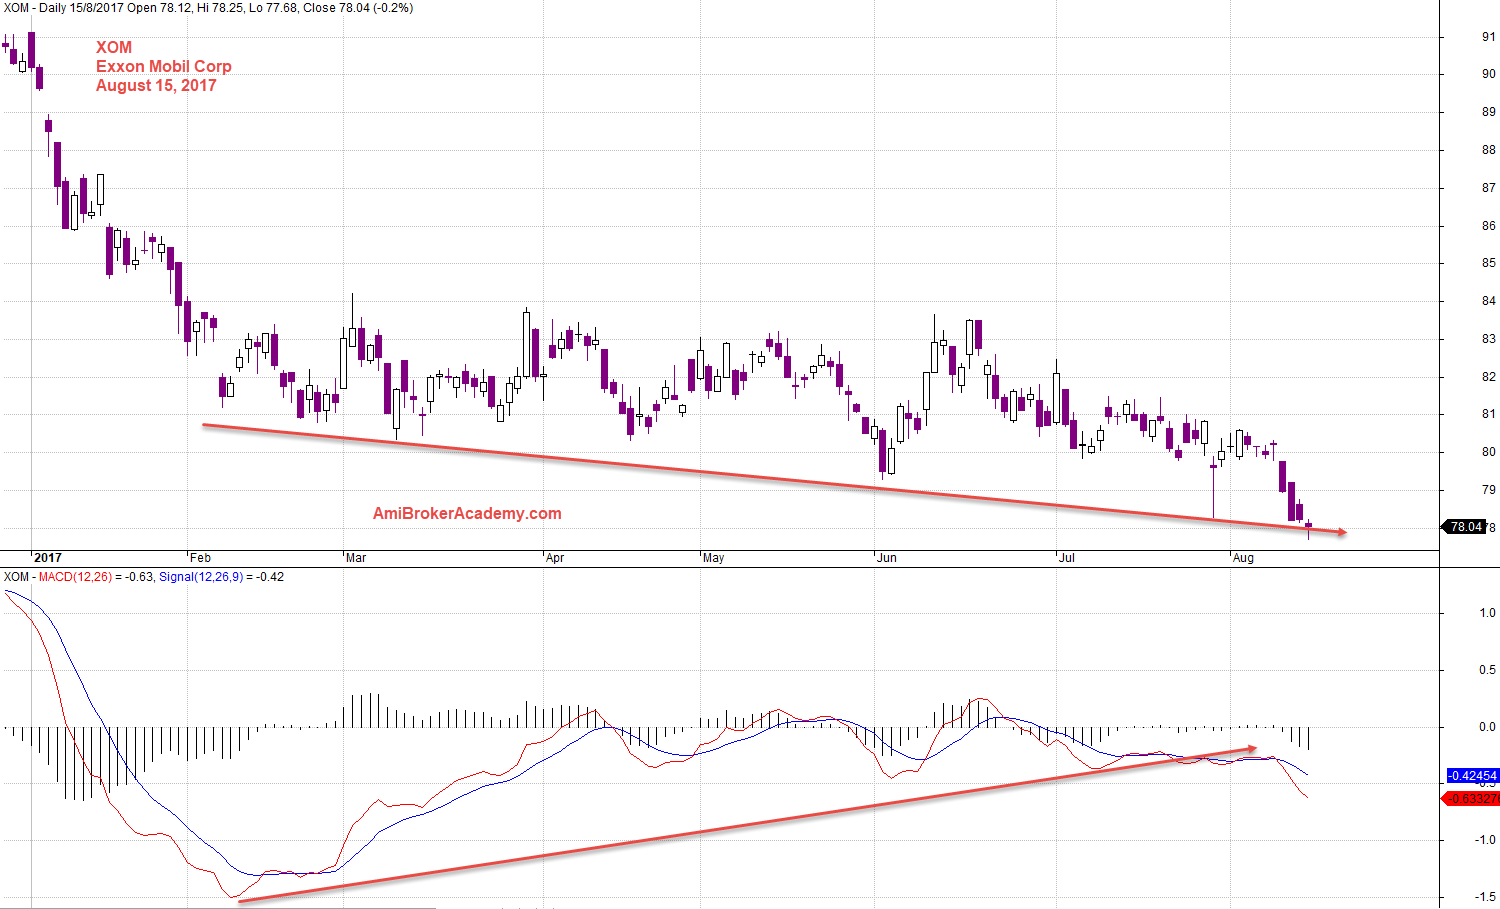
August 15, 2017 XOM Exxon Mobil Corp and MACD Signals
Thanks for visit the site here. You could also find free MACD scan here in this site too.
Moses
AmiBrokerAcademy.com
Disclaimer
The above result is for illustration purpose. It is not meant to be used for buy or sell decision. We do not recommend any particular stocks. If particular stocks of such are mentioned, they are meant as demonstration of Amibroker as a powerful charting software and MACD. Amibroker can program to scan the stocks for buy and sell signals.
These are script generated signals. Not all scan results are shown here. The MACD signal should use with price action. Users must understand what MACD and price action are all about before using them. If necessary you should attend a course to learn more on Technical Analysis (TA) and Moving Average Convergence Divergence, MACD.
Once again, the website does not guarantee any results or investment return based on the information and instruction you have read here. It should be used as learning aids only and if you decide to trade real money, all trading decision should be your own.