Welcome to AmiBrokerAcademy.com.
This website uses powerful charting software AmiBroker for charting and indicators.
You are here, maybe you want to understand and know the cause why the market in the bearish. You may already read about the China currency has been lower in the last few days; depreciation? Depreciating currency?
Picture Worth a Thousand Words
Many of the answer are the additional lines and comments on the chart. See chart for more information.
Trading Strategy
There are number of trading strategy, reversal, trend continuation, break out and so on. Many traders trade reversal strategy.
For reversal strategy traders are looking for top or bottom.
H M Gartley
H M Gartley in May 1935 published a 446 pages book title Profits in the Stock Market discussed a chart pattern is now know as a reversal strategy, Gartley 222 Reversal Chart pattern.
Remember, always wait for the chart pattern to complete, for example wait for three candlestick to complete a mountain or valley be for connection the top or bottom.
Singapore Stock DBS Group Holdings Ltd Analysis
Scenario 1: A View from 2009 DBS Group Holdings
From the chart, the price action look as if going to touch the significant level.
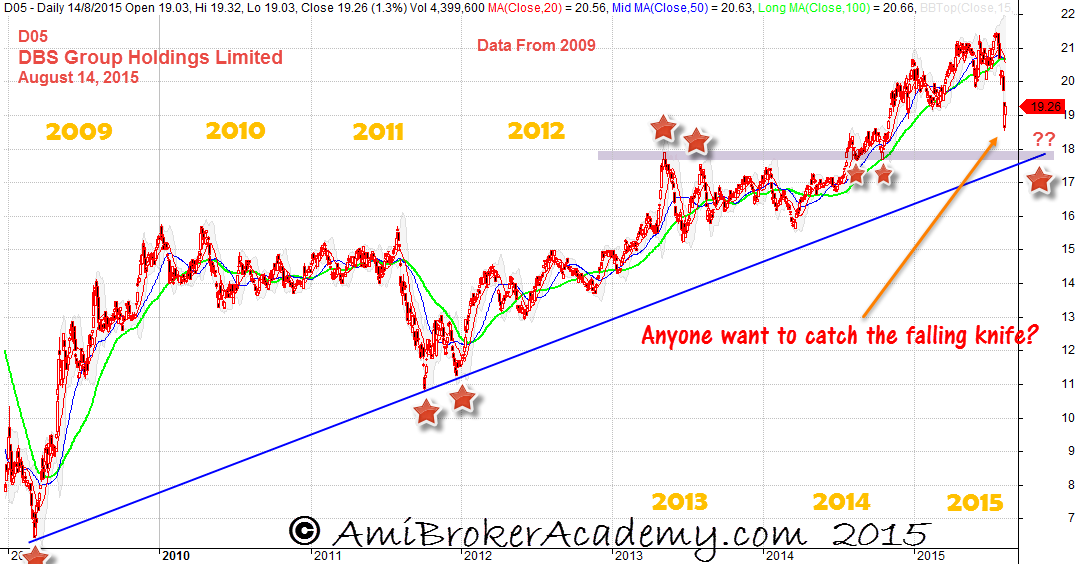
August 14, 2015 DBS Group Holdings Data Since 2009
Scenario 2: A Closed Up View DBS Group Holdings
The stock has been on an uptrend, the price action has been supported by trendline. Now the price action is break out of ‘neckline’. The price action is supported by a significant level. If the level can not stop the falling, the next level may be able to stop the fall, see chart for details.
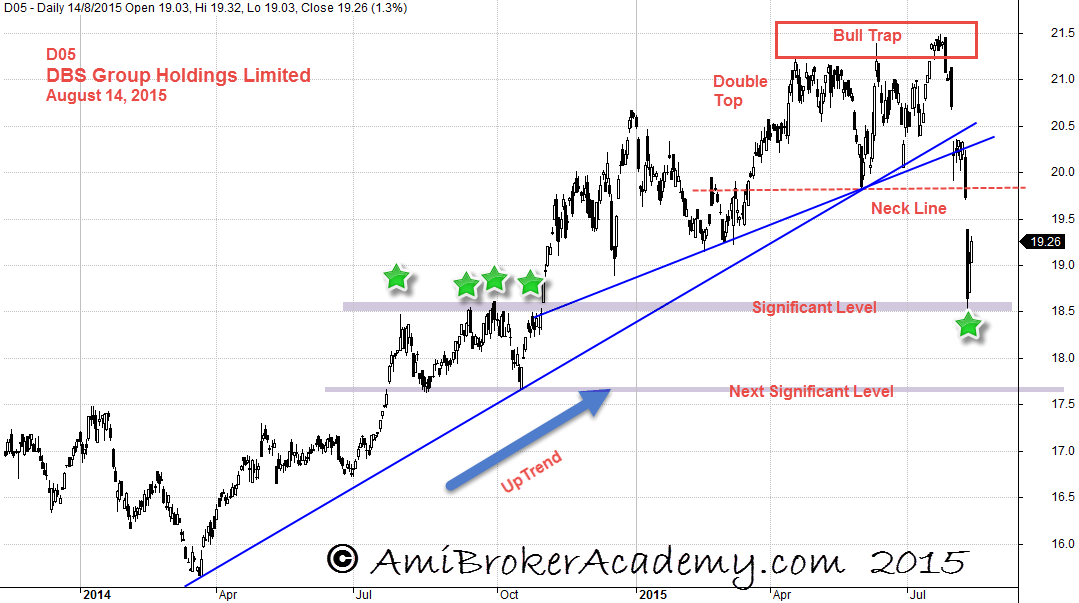
August 14. 2015 DBS Group Holdings Limited
Scenario 3: DBS Group Holdings and Moving Averages – Dead Cross
Price action has been bounced off Moving Average, especially 100 MA. Moving Average is a great visual tool to spot bullish or bearish price action.
Now the MAs has met for Dead Cross, the price action has fallen below MAs. The price action will retrace back to MA. You can buy when the PA break out MA and go above, or sell when PA resist and fall below MA.
Remember all set up can fail. Trade with eyes open.
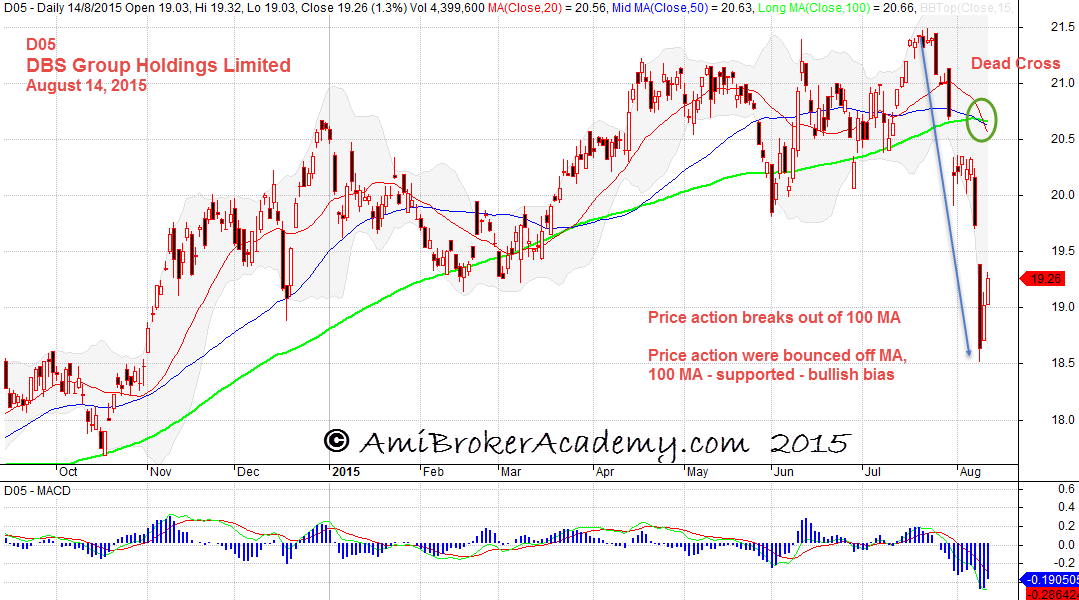
August 14, 2015 DBS Group Holding and Moving Averages
Scenario 4: DBS Group and River
River is made up of two moving average, moving average of your choice the high and low. River is a great tool, a great visual tool to spot the trading opportunity.
PA has been crossing up and down of River. PA now crossed below River and stay below River. River is pointing down, pointing at 5 o’clock, very bearish.
Pay attention to MACD and MACD Histogram; bearish.
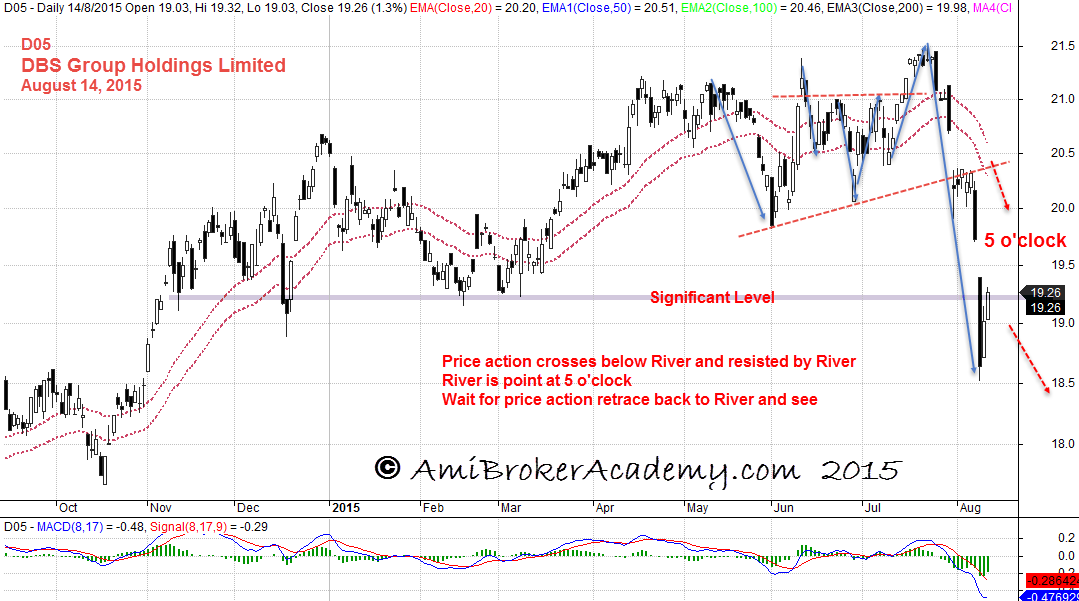
August 14, 2015 DBS Group Holdings Limited and River
Always draw lines on your chart and you many have more idea what next.
Thank you for visiting the website. Have fun!
You can read more about River on Raghee Horner Strategy.
Read from ForexFactory.com.
Moses
DISCLAIMER
Website advice, “Stock trading is not a get rich quick scheme and it is high risk”.
Information provided here is of the nature of a general comment only and no intend to be specific for trading advice. It has prepared without regard to any particular investment objectives, financial situation or needs. Information should NOT be considered as an offer or enticement to buy, sell or trade.
You should seek advice from your broker, or licensed investment advisor, before taking any action.
The website does not guarantee any results or investment return based on the information and instruction you have read here. It should be used as learning aids.
THE CONTENTS HERE REFLECT THE AUTHOR’S VIEWS ACQUIRED THROUGH HIS EXPERIENCE ON THE TOPIC. THE AUTHOR OR WEBSITE DISCLAIMS ANY LOSS OR LIABILITY CAUSED BY THE UTILIZATION OF ANY INFORMATION PRESENTED HEREIN.
BESIDES THAT THE SOURCES MENTIONED HEREIN ARE ASSUMED TO BE RELIABLE AT THE TIME OF WRITING, THE AUTHOR AND WEBSITE ARE NOT RESPONSIBLE FOR THEIR ACCURACY AND ACTIVITIES.
THE CONTENT ONLY SHOULD BE CONSIDERED SOLELY FOR BASIC INFORMATION.
COPYRIGHT © 2015 Moses @ AmiBrokerAcademy.com. ALL RIGHTS RESERVED.
NO PART OF THE CONTENT MAY BE ALTERED, COPIED, OR DISTRIBUTED, WITHOUT PRIOR WRITTEN PERMISSION OF THE AUTHOR OR SITE.
ALL PRODUCT NAMES, LOGOS, AND TRADEMARKS ARE PROPERTY OF THEIR RESPECTIVE OWNERS WHO HAVE NOT NECESSARILY ENDORSED, SPONSORED, REVIEWED OR APPROVED THIS PUBLICATION.