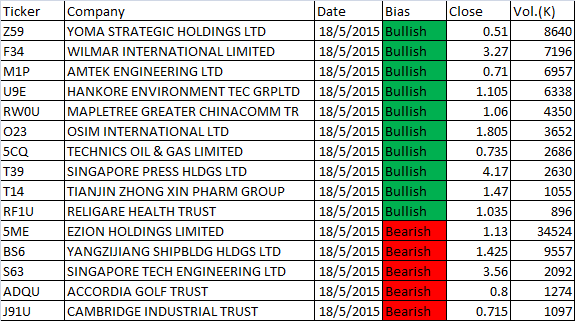
May 18 Singapore Stock Market MACD Scanner
MACD stands for Moving Average Convergence Divergence. The indicator is made up of 2 lines.
On this post, we provide list of Singapore stocks based on stocks more than fifty (50) cents and has 500,000 shares changed hands
- MACD line crosses above MACD signal – Bullish trend
- MACD line crosses above zero line – Bullish trend
- MACD Histogram +ve Divergence – Bullish trend
- MACD line crosses below MACD signal – Bearish trend
- MACD line crosses below zero line – Bearish trend
- MACD Histogram -ve Divergence – Bearish trend
Sell In May And Go Away
A well-known trading saying that warns investors to sell their stock holdings in May to avoid a seasonal decline in stock markets.
The “sell in May and go away” strategy is that an investor who sells his or her stock holdings in May and gets back into the equity market in November. This is to avoid the volatile between May-October period.
Can we see this in Singapore market? See Straits Times Index for details; chart worth a thousand words.
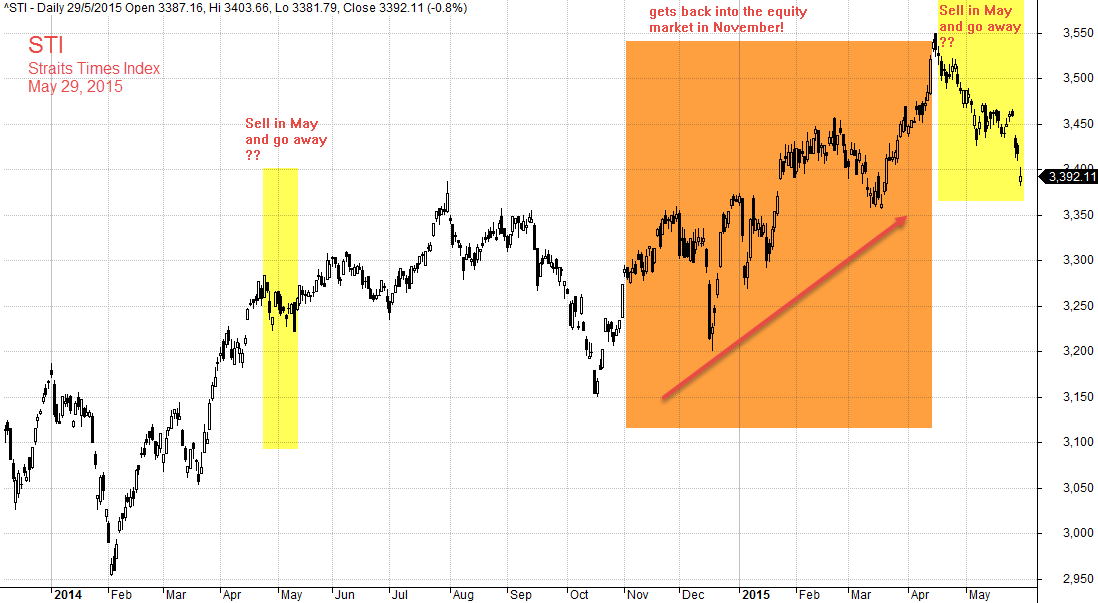
May 29, 2015 Straits Times Index, STI
Thanks for visiting the website.
Moses
DISCLAIMER
Site advice, “Stock trading is not a get rich quick scheme and it is high risk”.
Information provided here is of the nature of a general comment only and no intend to be specific for trading advice. It has prepared without regard to any particular investment objectives, financial situation or needs. Information should NOT be considered as an offer or enticement to buy, sell or trade.
You should seek advice from your broker, or licensed investment advisor, before taking any action.
The website does not guarantee any results or investment return based on the information and instruction you have read here. It should be used as learning aids.