March 3, 2016
Welcome to AmiBrokerAcademy.com.
At the start of the year (2016), we asked what was your strategy for the year, and we were looking at SATS. Stunning that when majority of the stocks were declining, and SATS was up roaring, bullish.
How is SATS performed so far?
Can 2016 Continue to Be a Good Year again for SATS Stock?
Price action is squeezed and retested the resistance. Energy is accumulating, a breakout coming soon. Potential bullish flag.
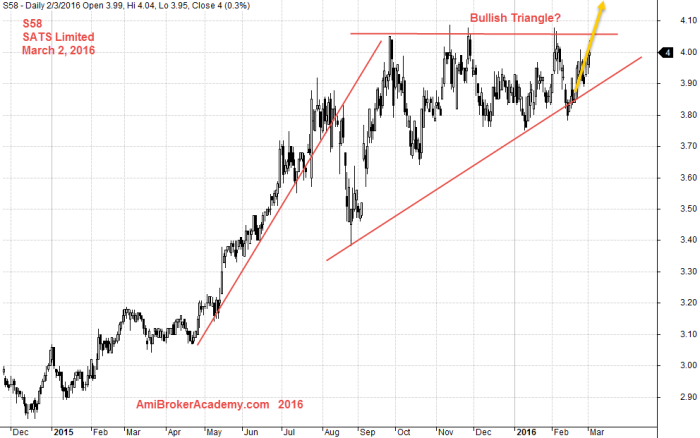
March 2, 2016 SATS Limited Daily
While all stocks are experiencing a decline pressure just right at the start of 2016, China economy continue to stumble down and Singapore manufacturing sector shrank further. Discounting the the US stock market influences. For Straits Times Index was down further.
But SATS, S58 stock is unique and stand out to continue it bullishness like 2015? Market can only do one of the three things, 1) up, 2) down, and 3) sideways. Building up a bullish flag.
Picture Worth a Thousand Words
$4.09 seem to be a limit now; the price keeps retest the same peak. However, look at the trendline drawn. So far, the low did not form a lower low. Good sign.
Trade What you See
All setup may fail. Trade what you see.
Moses Stocks Analysis and Scan
Disclaimer: All information, data and material contained, presented, or provided on amibrokeracademy.com is for educational purposes only. It is not to be construed or intended as providing trading or legal advice. Decisions you make about your trading or investment are important to you and your family, therefore should be made in consultation with a competent financial advisor or professional. We are not financial advisor and do not claim to be. Any views expressed here-in are not necessarily those held by amibrokeracademy.com. You are responsible for your trade decision and wealth being.