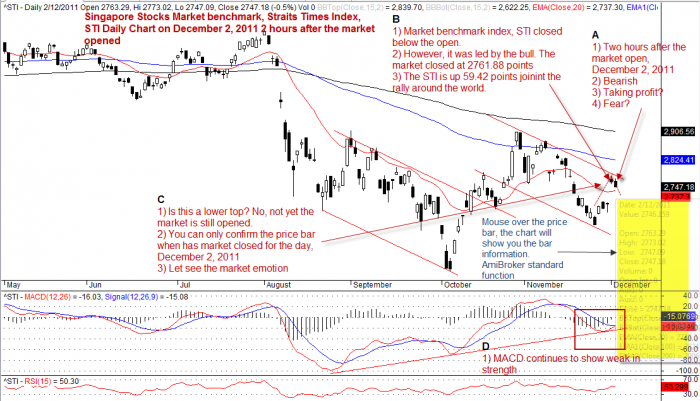
Technical Analysis, chart tells you a story, the market fears and greed. What is next for Singapore stocks market? The chart is captured at two hours after the market open on December 2. The market opens at 2763.29 points 1.41 points higher. However confident was weak, it drops to 2747.18 points. The index is current resisted by the trendline. Some are fear and start taking profit, for those that felt they have missed out from the rally will come in now to buy. Will see. Are you one of them? Selling or buying?
Is this the lower top? No, not yet. It can only be confirmed when the market closed. If you have no idea, it is alright to stay aside and do not trade.
Trade with caution!
Disclaimer
The information presented here is for illustration purpose. It is not meant to be used for buy or sell decision. We do not recommend you trade base on what you read here. If particular strategy, technique, trigger are mentioned, they are meant as demonstration how it being used by some trader.
Trading in any financial instrument such as stocks, options, indices, currencies and future involve risk and should not undertake without learning from professional traders. Readers may carry out trading based on what they learnt, but all risks and potential financial losses are the readers own responsibility.
Once again, the website does not guarantee any results or investment return based on the information and instruction you have read here.